- Function File:
levels =statelevels(A)¶ - Function File:
levels =statelevels(A, nbins)¶ - Function File:
levels =statelevels(A, nbins, method)¶ - Function File:
levels =statelevels(A, nbins, method, bounds)¶ - Function File:
[levels, histograms] =statelevels(…)¶ - Function File:
[levels, histograms, binlevels] =statelevels(…)¶ - Function File: statelevels
(…)¶ Estimate state-level for bilevel waveform A using histogram method
INPUTS:
- A
Bylevel waveform
- nbins
Number of histogram bins (100 default)
- method
State-level estimation method ’mode’ (default) or ’mean’.
- bounds
2 element vector for histogram lower and upper bounds. Values outside of this will be ignored.
OUTPUTS:
- levels
Levels of high and low states
- histograms
Histogram counts
- binlevels
Histogram bincenters
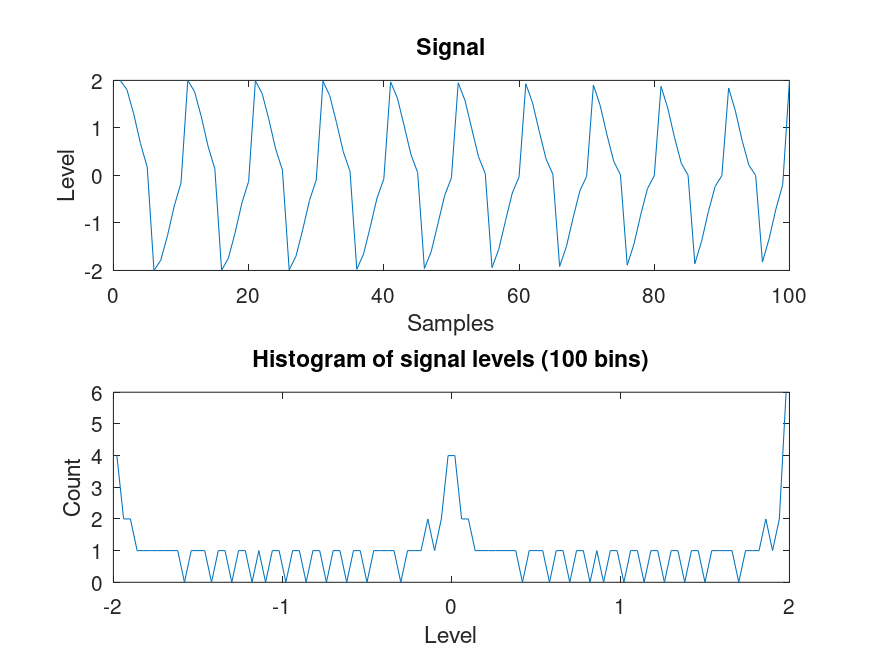
If no outputs are provided, the signal and histogram will be plotted, and display the levels.
Demonstration 1
The following code
 # Generate test signal
 t = linspace(0,2*pi*10,100);
 X = square(t) + cos(t);
 # plot the waveform and provide the levels
 statelevels(X)
Produces the following output
ans =

  -1.9795   1.9800
and the following figure
| Figure 1 |
|---|
 |
Package: signal