- Function File:
y =tripuls(t)¶ - Function File:
y =tripuls(t, w)¶ - Function File:
y =tripuls(t, w, skew)¶ Generate a triangular pulse over the interval [-w/2,w/2), sampled at times t. This is useful with the function
pulstranfor generating a series of pulses.skew is a value between -1 and 1, indicating the relative placement of the peak within the width. -1 indicates that the peak should be at -w/2, and 1 indicates that the peak should be at w/2. The default value is 0.
Example:
fs = 11025;  # arbitrary sample rate
f0 = 100;    # pulse train sample rate
w = 0.3/f0;  # pulse width 3/10th the distance between pulses
plot (pulstran (0:1/fs:4/f0, 0:1/f0:4/f0, "tripuls", w));
See also: gauspuls, pulstran, rectpuls.
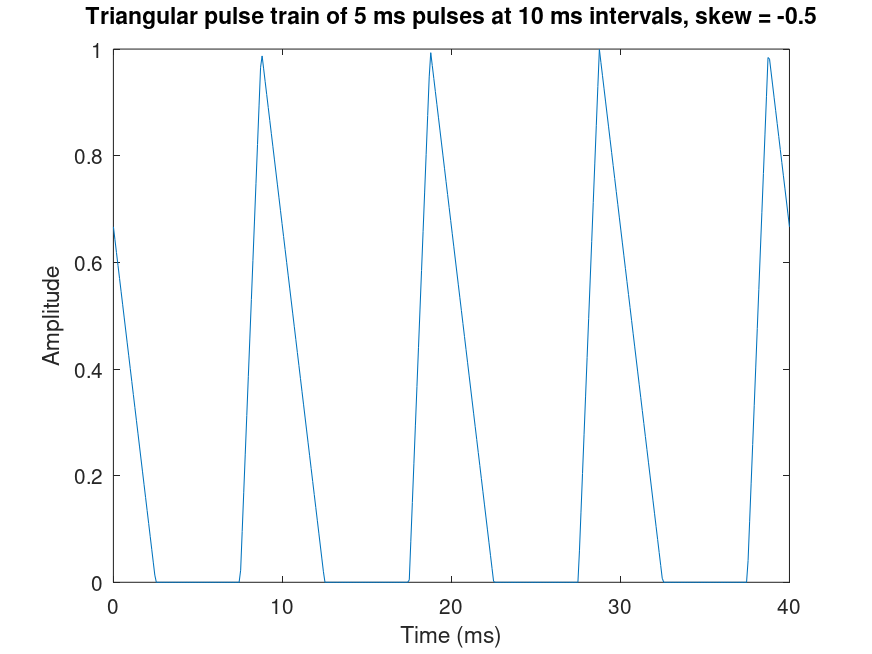
Demonstration 1
The following code
 fs = 11025;  # arbitrary sample rate
 f0 = 100;    # pulse train sample rate
 w = 0.5/f0;  # pulse width 1/10th the distance between pulses
 x = pulstran (0:1/fs:4/f0, 0:1/f0:4/f0, "tripuls", w);
 plot ([0:length(x)-1]*1000/fs, x);
 xlabel ("Time (ms)");
 ylabel ("Amplitude");
 title ("Triangular pulse train of 5 ms pulses at 10 ms intervals");
Produces the following figure
| Figure 1 |
|---|
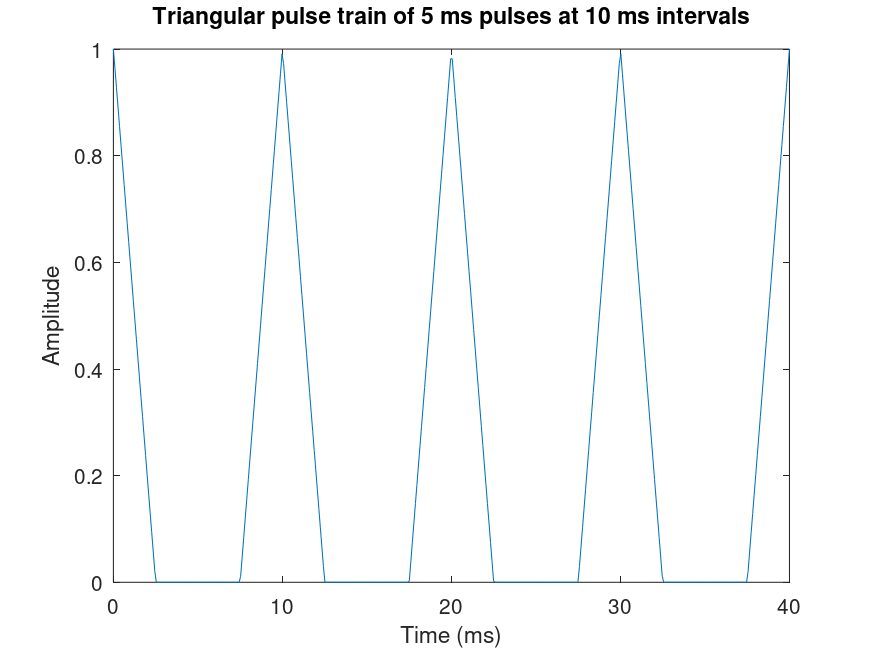 |
Demonstration 2
The following code
 fs = 11025;  # arbitrary sample rate
 f0 = 100;    # pulse train sample rate
 w = 0.5/f0;  # pulse width 1/10th the distance between pulses
 x = pulstran (0:1/fs:4/f0, 0:1/f0:4/f0, "tripuls", w, -0.5);
 plot ([0:length(x)-1]*1000/fs, x);
 xlabel ("Time (ms)");
 ylabel ("Amplitude");
 title ("Triangular pulse train of 5 ms pulses at 10 ms intervals, skew = -0.5");
Produces the following figure
| Figure 1 |
|---|
 |
Package: signal