- Function File: fnplt (pp, 'plt') 
plots spline
See also: ppval, spline, csape.
Demonstration 1
The following code
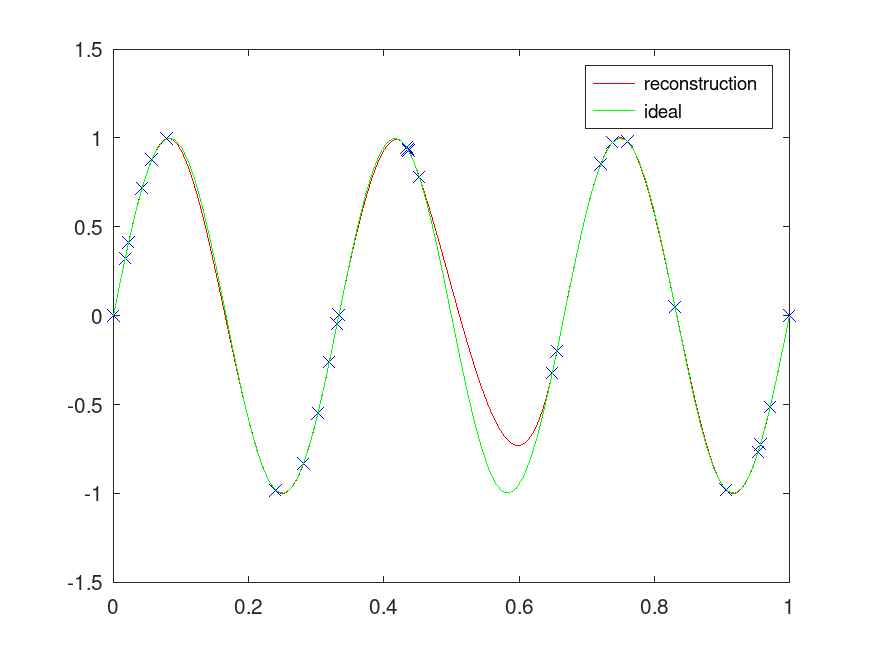
 x = [ 0; sort(rand(25,1)); 1 ];
 pp = csape (x, sin (2*pi*3*x), 'periodic');
 axis([0,1,-2,2]);
 title('Periodic spline reconstruction of randomly sampled sine');
 fnplt (pp,'r;reconstruction;');
 t=linspace(0,1,100); y=sin(2*pi*3*t);
 hold on; plot(t,y,'g;ideal;'); hold off;
 axis; title("");
Produces the following figure
| Figure 1 |
|---|
 |
Package: splines