- Function File: [q, Asq, info] = = anderson_darling_test (x, distribution)
-
Test the hypothesis that x is selected from the given distribution using the Anderson-Darling test. If the returned q is small, reject the hypothesis at the q*100% level.
The Anderson-Darling A^2 statistic is calculated as follows:
              n
A^2_n = -n - SUM (2i-1)/n log(z_i (1 - z_{n-i+1}))
             i=1
where z_i is the ordered position of the x’s in the CDF of the distribution. Unlike the Kolmogorov-Smirnov statistic, the Anderson-Darling statistic is sensitive to the tails of the distribution.
The distribution argument must be a either "uniform", "normal", or "exponential".
For "normal"’ and "exponential" distributions, estimate the distribution parameters from the data, convert the values to CDF values, and compare the result to tabluated critical values. This includes an correction for small n which works well enough for n >= 8, but less so from smaller n. The returned
info.Asq_correctedcontains the adjusted statistic.For "uniform", assume the values are uniformly distributed in (0,1), compute A^2 and return the corresponding p-value from
1-anderson_darling_cdf(A^2,n).If you are selecting from a known distribution, convert your values into CDF values for the distribution and use "uniform". Do not use "uniform" if the distribution parameters are estimated from the data itself, as this sharply biases the A^2 statistic toward smaller values.
[1] Stephens, MA; (1986), "Tests based on EDF statistics", in D’Agostino, RB; Stephens, MA; (eds.) Goodness-of-fit Techinques. New York: Dekker.
See also: anderson_darling_cdf.
Demonstration 1
The following code
 c = anderson_darling_test(10*rande(12,10000),'exponential');
 tabulate(100*c,100*[unique(c),1]);
 % The Fc column should report 100, 250, 500, 1000, 10000 more or less.
Produces the following output
bin     Fa       Fr%        Fc
       1    125      1.25%      125
     2.5    165      1.65%      290
       5    259      2.59%      549
      10    532      5.32%     1081
     100   8919     89.19%    10000
Demonstration 2
The following code
 c = anderson_darling_test(randn(12,10000),'normal');
 tabulate(100*c,100*[unique(c),1]);
 % The Fc column should report 100, 250, 500, 1000, 10000 more or less.
Produces the following output
bin     Fa       Fr%        Fc
       1     99      0.99%       99
     2.5    160      1.60%      259
       5    258      2.58%      517
      10    498      4.98%     1015
     100   8985     89.85%    10000
Demonstration 3
The following code
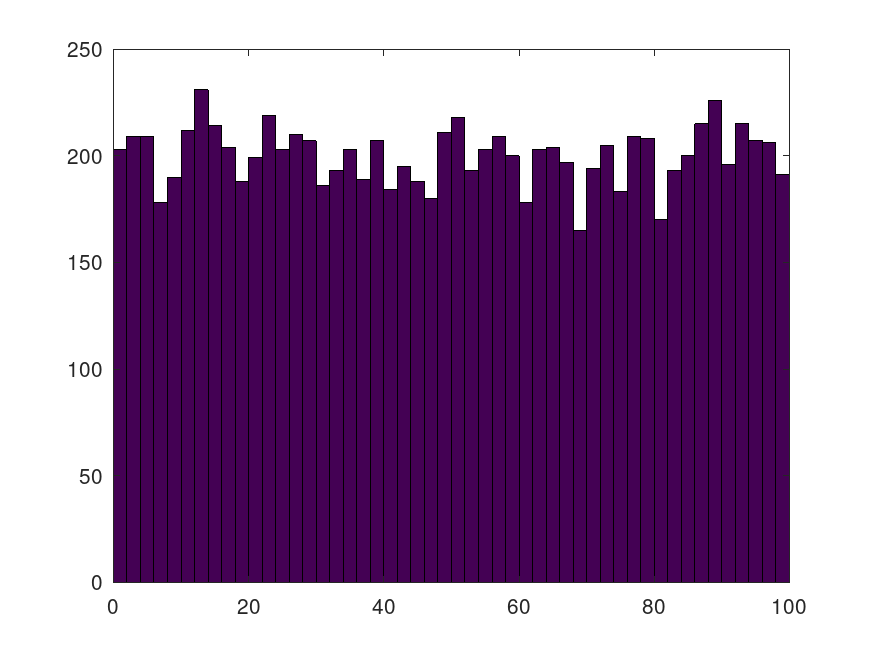
 c = anderson_darling_test(rand(12,10000),'uniform');
 hist(100*c,1:2:99);
 % The histogram should be flat more or less.
Produces the following figure
bin     Fa       Fr%        Fc
       1     99      0.99%       99
     2.5    160      1.60%      259
       5    258      2.58%      517
      10    498      4.98%     1015
     100   8985     89.85%    10000
| Figure 1 |
|---|
 |
Package: statistics