- Function File: p = anova1 (x)
- Function File: p = anova1 (x, group)
- Function File: p = anova1 (x, group, displayopt)
- Function File: [p, atab] = anova1 (x, …)
- Function File: [p, atab, stats] = anova1 (x, …)
-
Perform a one-way analysis of variance (ANOVA) for comparing the means of two or more groups of data under the null hypothesis that the groups are drawn from the same distribution, i.e. the group means are equal.
anova1 can take up to three input arguments:
- x contains the data and it can either be a vector or matrix. If x is a matrix, then each column is treated as a separate group. If x is a vector, then the group argument is mandatory.
- group contains the names for each group. If x is a matrix, then group can either be a cell array of strings of a character array, with one row per column of x. If you want to omit this argument, enter an empty array ([]). If x is a vector, then group must be a vector of the same length, or a string array or cell array of strings with one row for each element of x. x values corresponding to the same value of group are placed in the same group.
- displayopt is an optional parameter for displaying the groups contained in the data in a boxplot. If omitted, it is ’on’ by default. If group names are defined in group, these are used to identify the groups in the boxplot. Use ’off’ to omit displaying this figure.
anova1 can return up to three output arguments:
- p is the p-value of the null hypothesis that all group means are equal.
- atab is a cell array containing the results in a standard ANOVA table.
- stats is a structure containing statistics useful for performing a multiple comparison of means with the MULTCOMPARE function.
If anova1 is called without any output arguments, then it prints the results in a one-way ANOVA table to the standard output. It is also printed when displayopt is ’on’.
Examples:
x = meshgrid (1:6);
x = x + normrnd (0, 1, 6, 6);
anova1 (x, [], 'off');
[p, atab] = anova1(x);
x = ones (50, 4) .* [-2, 0, 1, 5];
x = x + normrnd (0, 2, 50, 4);
groups = {"A", "B", "C", "D"};
anova1 (x, groups);
Demonstration 1
The following code
 x = meshgrid (1:6);
 x = x + normrnd (0, 1, 6, 6);
 anova1 (x, [], 'off');
Produces the following output
ANOVA Table
Source        SS      df        MS       F      Prob>F
------------------------------------------------------
Columns   116.4083     5    23.2817    22.35    0.0000
Error      31.2554    30     1.0418
Total     147.6637    35
Demonstration 2
The following code
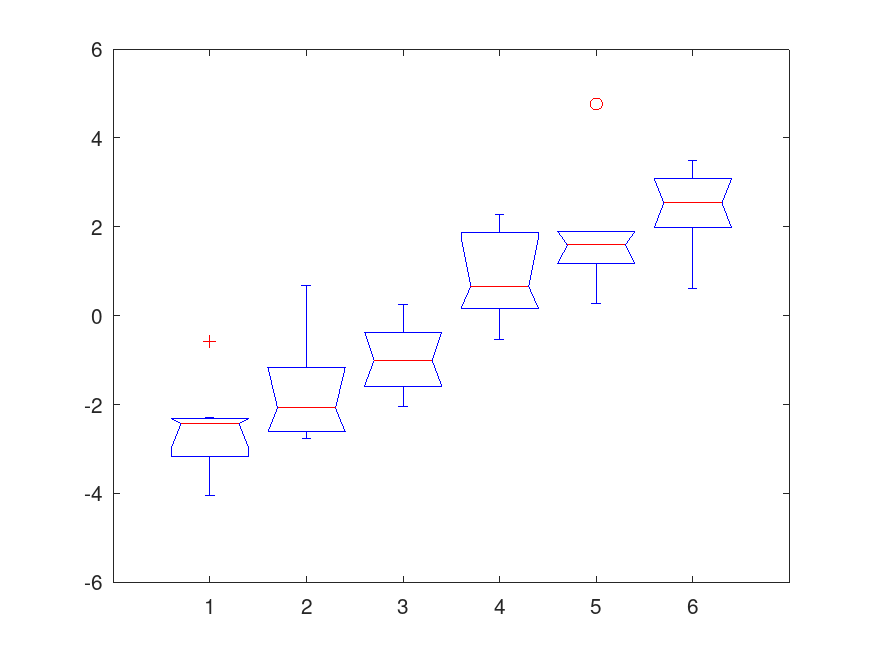
 x = meshgrid (1:6);
 x = x + normrnd (0, 1, 6, 6);
 [p, atab] = anova1(x);
Produces the following output
ANOVA Table
Source        SS      df        MS       F      Prob>F
------------------------------------------------------
Columns   119.6633     5    23.9327    16.56    0.0000
Error      43.3577    30     1.4453
Total     163.0210    35
and the following figure
| Figure 1 |
|---|
 |
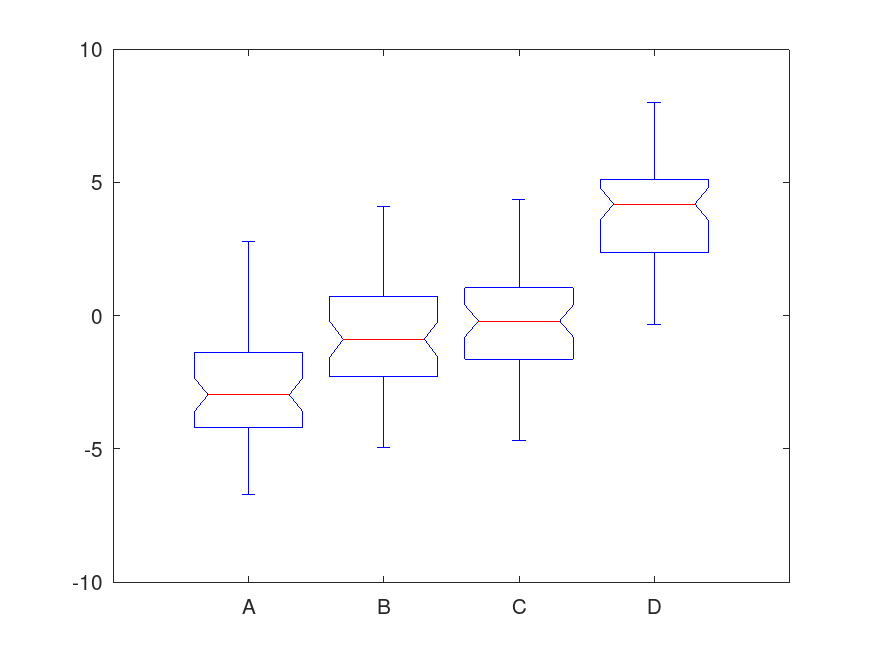
Demonstration 3
The following code
 x = ones (50, 4) .* [-2, 0, 1, 5];
 x = x + normrnd (0, 2, 50, 4);
 groups = {"A", "B", "C", "D"};
 anova1 (x, groups);
Produces the following output
ANOVA Table
Source        SS      df        MS       F      Prob>F
------------------------------------------------------
Columns  1197.0018     3   399.0006   101.49    0.0000
Error     770.5250   196     3.9313
Total    1967.5268   199
and the following figure
| Figure 1 |
|---|
 |
Package: statistics