- Function File: s = boxplot (data)
- Function File: s = boxplot (data, group)
- Function File: s = boxplot (data, notched, symbol, orientation, whisker, …)
- Function File: s = boxplot (data, group, notched, symbol, orientation, whisker, …)
- Function File: s = boxplot (data, options)
- Function File: s = boxplot (data, group, options, …)
- Function File: [… h]= boxplot (data, …)
Produce a box plot.
A box plot is a graphical display that simultaneously describes several important features of a data set, such as center, spread, departure from symmetry, and identification of observations that lie unusually far from the bulk of the data.
Input arguments (case-insensitive) recognized by boxplot are:
- data is a matrix with one column for each data set, or a cell vector with one cell for each data set. Each cell must contain a numerical row or column vector (NaN and NA are ignored) and not a nested vector of cells.
- notched = 1 produces a notched-box plot. Notches represent a robust
estimate of the uncertainty about the median.
notched = 0 (default) produces a rectangular box plot.
notched within the interval (0,1) produces a notch of the specified depth. Notched values outside (0,1) are amusing if not exactly impractical.
- symbol sets the symbol for the outlier values. The default symbol
for points that lie outside 3 times the interquartile range is ’o’;
the default symbol for points between 1.5 and 3 times the interquartile
range is ’+’.
Alternative symbol settings:symbol = ’.’: points between 1.5 and 3 times the IQR are marked with ’.’ and points outside 3 times IQR with ’o’.
symbol = [’x’,’*’]: points between 1.5 and 3 times the IQR are marked with ’x’ and points outside 3 times IQR with ’*’.
- orientation = 0 makes the boxes horizontally.
orientation = 1 plots the boxes vertically (default). Alternatively, orientation can be passed as a string, e.g., ’vertical’ or ’horizontal’. - whisker defines the length of the whiskers as a function of the IQR
(default = 1.5). If whisker = 0 then
boxplotdisplays all data values outside the box using the plotting symbol for points that lie outside 3 times the IQR. - group may be passed as an optional argument only in the second position after data. group contains a numerical vector defining separate categories, each plotted in a different box, for each set of DATA values that share the same group value or values. With the formalism (data, group), both must be vectors of the same length.
- options are additional paired arguments passed with the formalism
(Name, Value) that provide extra functionality as listed below.
options can be passed at any order after the initial arguments and
are case-insensitive.
’Notch’ ’on’ Notched by 0.25 of the boxes width. ’off’ Produces a straight box. scalar Proportional width of the notch. ’Symbol’ ’.’ Defines only outliers between 1.5 and 3 IQR. [’x’,’*’] 2nd character defines outliers > 3 IQR ’Orientation’ ’vertical’ Default value, can also be defined with numerical 1. ’horizontal’ Can also be defined with numerical 0. ’Whisker’ scalar Multiplier of IQR (default is 1.5). ’OutlierTags’ ’on’ or 1 Plot the vector index of the outlier value next to its point. ’off’ or 0 No tags are plotted (default value). ’Sample_IDs’ ’cell’ A cell vector with one cell for each data set containing a nested cell vector with each sample’s ID (should be a string). If this option is passed, then all outliers are tagged with their respective sample’s ID string instead of their vector’s index. ’BoxWidth’ ’proportional’ Create boxes with their width proportional to the number of samples in their respective dataset (default value). ’fixed’ Make all boxes with equal width. ’Widths’ scalar Scaling factor for box widths (default value is 0.4). ’CapWidths’ scalar Scaling factor for whisker cap widths (default value is 1, which results to ’Widths’/8 halflength) ’BoxStyle’ ’outline’ Draw boxes as outlines (default value). ’filled’ Fill boxes with a color (outlines are still plotted). ’Positions’ vector Numerical vector that defines the position of each data set. It must have the same length as the number of groups in a desired manner. This vector merely defines the points along the group axis, which by default is [1:number of groups]. ’Labels’ cell A cell vector of strings containing the names of each group. By default each group is labeled numerically according to its order in the data set ’Colors’ character string or Nx3 numerical matrix If just one character or 1x3 vector of RGB values, specify the fill color of all boxes when BoxStyle = ’filled’. If a character string or Nx3 matrix is entered, box #1’s fill color corrresponds to the first character or first matrix row, and the next boxes’ fill colors corresponds to the next characters or rows. If the char string or Nx3 array is exhausted the color selection wraps around.
Supplemental arguments not described above (…) are concatenated and passed to the plot() function.
The returned matrix s has one column for each data set as follows:
1 Minimum 2 1st quartile 3 2nd quartile (median) 4 3rd quartile 5 Maximum 6 Lower confidence limit for median 7 Upper confidence limit for median The returned structure h contains handles to the plot elements, allowing customization of the visualization using set/get functions.
Example
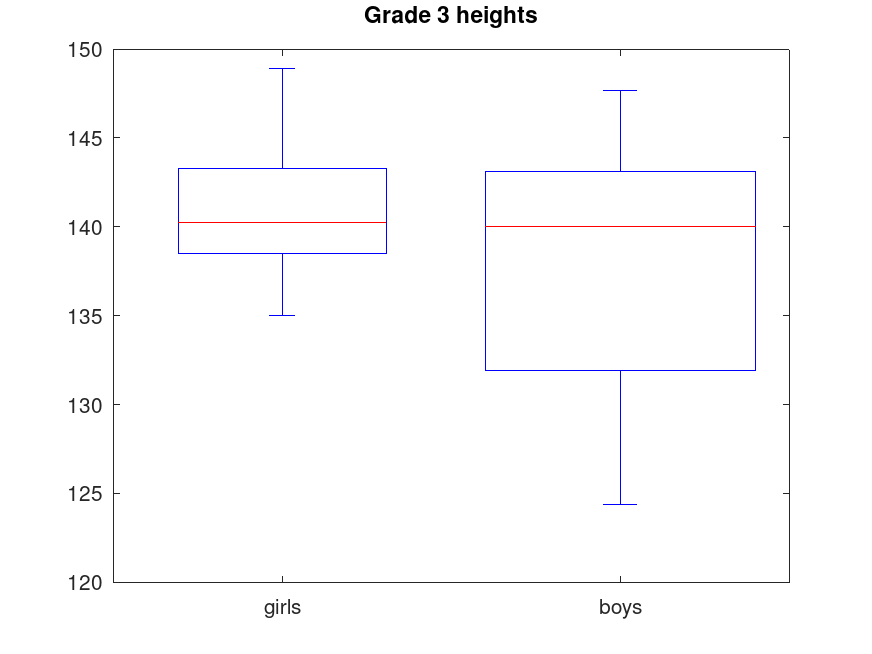
title ("Grade 3 heights");
axis ([0,3]);
set(gca (), "xtick", [1 2], "xticklabel", {"girls", "boys"});
boxplot ({randn(10,1)*5+140, randn(13,1)*8+135});
Demonstration 1
The following code
 axis ([0, 3]);
 boxplot ({(randn(10, 1) * 5 + 140), (randn (13, 1) * 8 + 135)});
 set (gca (), "xtick", [1 2], "xticklabel", {"girls", "boys"})
 title ("Grade 3 heights");
Produces the following figure
| Figure 1 |
|---|
 |
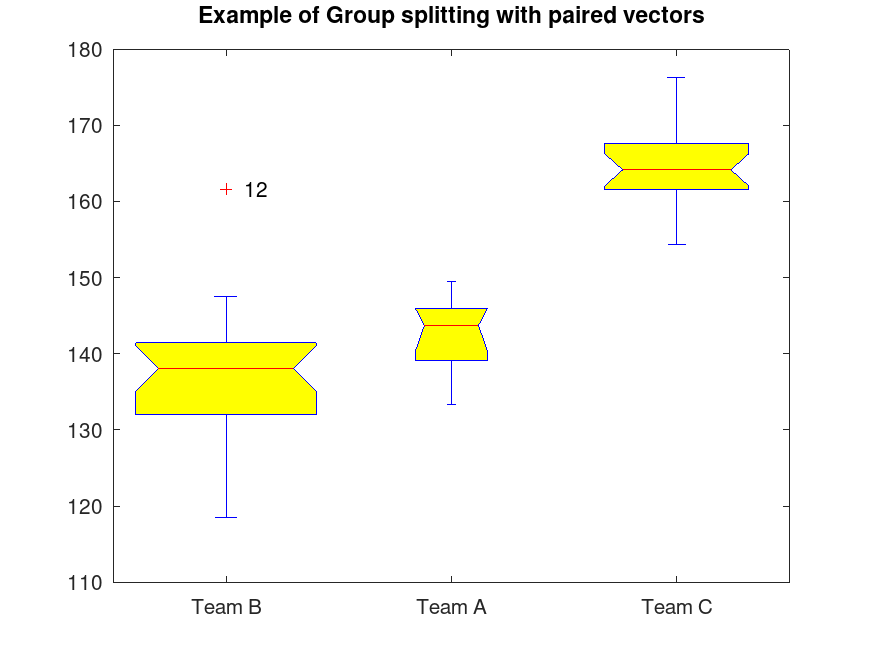
Demonstration 2
The following code
 data = [(randn (10, 1) * 5 + 140); (randn (25, 1) * 8 + 135); ...
         (randn (20, 1) * 6 + 165)];
 groups = [(ones (10, 1)); (ones (25, 1) * 2); (ones (20, 1) * 3)];
 labels = {"Team A", "Team B", "Team C"};
 pos = [2, 1, 3];
 boxplot (data, groups, "Notch", "on", "Labels", labels, "Positions", pos, ...
          "OutlierTags", "on", "BoxStyle", "filled");
 title ("Example of Group splitting with paired vectors");
Produces the following figure
| Figure 1 |
|---|
 |
Demonstration 3
The following code
 boxplot (randn (100, 9), "notch", "on", "boxstyle", "filled", ...
          "colors", "ygcwkmb", "whisker", 1.2);
 title ("Example of different colors specified with characters");
Produces the following figure
| Figure 1 |
|---|
 |
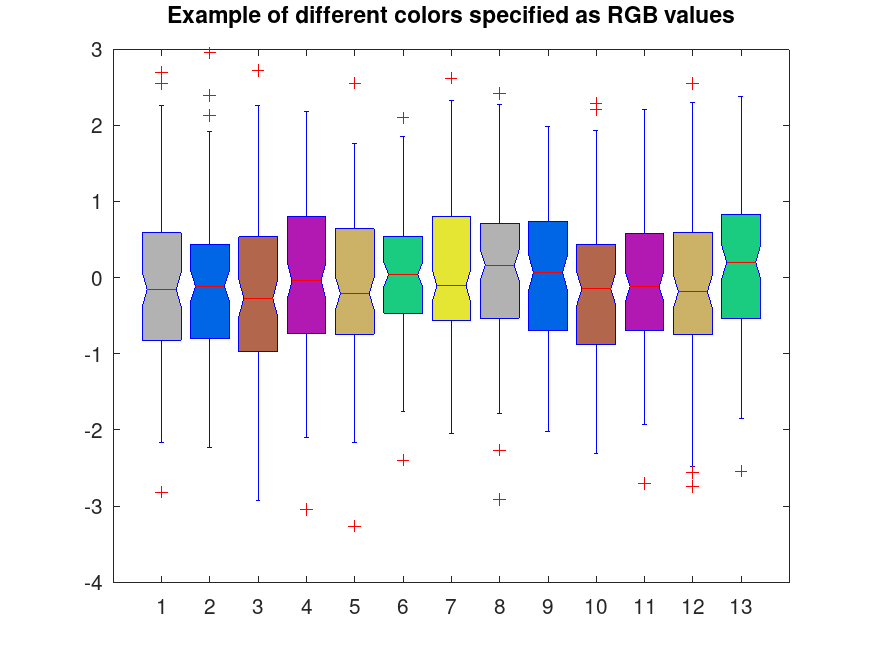
Demonstration 4
The following code
 colors = [0.7 0.7 0.7; ...
           0.0 0.4 0.9; ...
           0.7 0.4 0.3; ...
           0.7 0.1 0.7; ...
           0.8 0.7 0.4; ...
           0.1 0.8 0.5; ...
           0.9 0.9 0.2];
 boxplot (randn (100, 13), "notch", "on", "boxstyle", "filled", ...
          "colors", colors, "whisker", 1.3, "boxwidth", "proportional");
 title ("Example of different colors specified as RGB values");
Produces the following figure
| Figure 1 |
|---|
 |
Package: statistics