- Function File: [dCor, dCov, dVarX, dVarY] = dcov (x, y, index=1)
Distance correlation, covariance and correlation statistics.
It returns distace correlation (dCor), distance covariance (dCov), diatance variace on x (dVarX) and distance variance on y (dVarY).
Reference: https://en.wikipedia.org/wiki/Distance_correlation
See also: corr, cov.
Demonstration 1
The following code
 base=@(x) (x- min(x))./(max(x)-min(x));
 N = 5e2;
 x = randn (N,1); x = base (x);
 z = randn (N,1); z = base (z);
 # Linear relations
 cy = [1 0.55 0.3 0 -0.3 -0.55 -1];
 ly = x .* cy;
 ly(:,[1:3 5:end]) = base (ly(:,[1:3 5:end]));
 # Correlated Gaussian
 cz = 1 - abs (cy);
 gy = base ( ly + cz.*z);
 # Shapes
 sx      = repmat (x,1,7);
 sy      = zeros (size (ly));
 v       = 2 * rand (size(x,1),2) - 1;
 sx(:,1) = v(:,1); sy(:,1) = cos(2*pi*sx(:,1)) + 0.5*v(:,2).*exp(-sx(:,1).^2/0.5);
 R       =@(d) [cosd(d) sind(d); -sind(d) cosd(d)];
 tmp     = R(35) * v.';
 sx(:,2) = tmp(1,:); sy(:,2) = tmp(2,:);
 tmp     = R(45) * v.';
 sx(:,3) = tmp(1,:); sy(:,3) = tmp(2,:);
 sx(:,4) = v(:,1); sy(:,4) = sx(:,4).^2 + 0.5*v(:,2);
 sx(:,5) = v(:,1); sy(:,5) = 3*sign(v(:,2)).*(sx(:,5)).^2  + v(:,2);
 sx(:,6) = cos (2*pi*v(:,1)) + 0.5*(x-0.5);
 sy(:,6) = sin (2*pi*v(:,1)) + 0.5*(z-0.5);
 sx(:,7) = x + sign(v(:,1)); sy(:,7) = z + sign(v(:,2));
 sy      = base (sy);
 sx      = base (sx);
 # scaled shape
 sc  = 1/3;
 ssy = (sy-0.5) * sc + 0.5;
 n = size (ly,2);
 ym = 1.2;
 xm = 0.5;
 fmt={'horizontalalignment','center'};
 ff = "% .2f";
 figure (1)
 for i=1:n
   subplot(4,n,i);
   plot (x, gy(:,i), '.b');
   axis tight
   axis off
   text (xm,ym,sprintf (ff, dcov (x,gy(:,i))),fmt{:})

   subplot(4,n,i+n);
   plot (x, ly(:,i), '.b');
   axis tight
   axis off
   text (xm,ym,sprintf (ff, dcov (x,ly(:,i))),fmt{:})

   subplot(4,n,i+2*n);
   plot (sx(:,i), sy(:,i), '.b');
   axis tight
   axis off
   text (xm,ym,sprintf (ff, dcov (sx(:,i),sy(:,i))),fmt{:})
   v = axis ();

   subplot(4,n,i+3*n);
   plot (sx(:,i), ssy(:,i), '.b');
   axis (v)
   axis off
   text (xm,ym,sprintf (ff, dcov (sx(:,i),ssy(:,i))),fmt{:})
 endfor
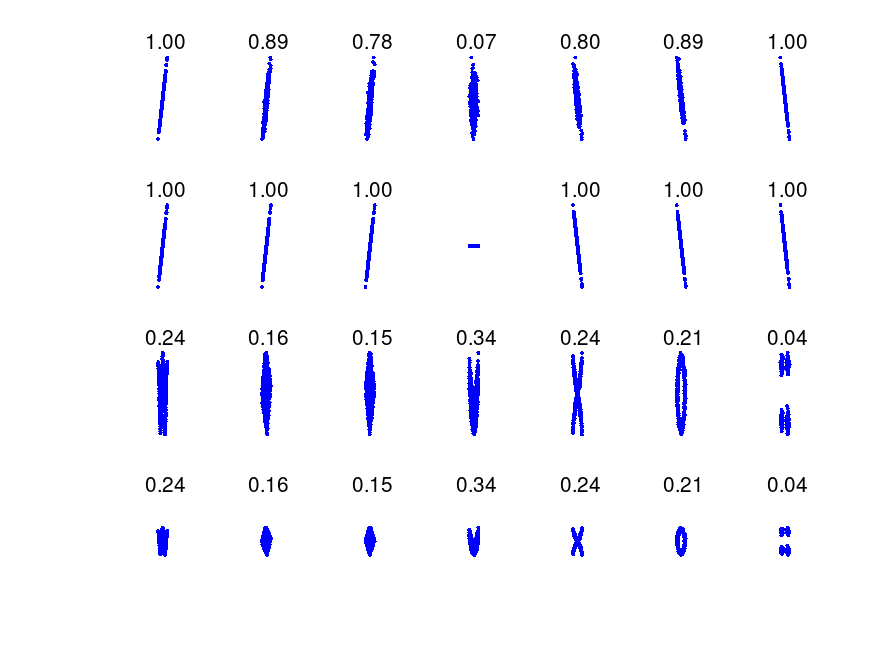
Produces the following figure
| Figure 1 |
|---|
 |
Package: statistics