- Function File: gscatter (x, y, g)
- Function File: gscatter (x, y, g, clr, sym, siz)
- Function File: gscatter (…, doleg, xnam, ynam)
- Function File: h = gscatter (…)
-
Draw a scatter plot with grouped data.
gscatteris a utility function to draw a scatter plot of x and y, according to the groups defined by g. Input x and y are numeric vectors of the same size, while g is either a vector of the same size as x or a character matrix with the same number of rows as the size of x. As a vector g can be numeric, logical, a character array, a string array (not implemented), a cell string or cell array.A number of optional inputs change the appearance of the plot:
- "clr"
defines the color for each group; if not enough colors are defined by
"clr",
gscattercycles through the specified colors. Colors can be defined as named colors, as rgb triplets or as indices for the currentcolormap. The default value is a different color for each group, according to the currentcolormap. - "sym"
is a char array of symbols for each group; if not enough symbols are defined
by "sym",
gscattercycles through the specified symbols. - "siz"
is a numeric array of sizes for each group; if not enough sizes are defined
by "siz",
gscattercycles through the specified sizes. - "doleg"
is a boolean value to show the legend; it can be either
on(default) oroff. - "xnam" is a character array, the name for the x axis.
- "ynam" is a character array, the name for the y axis.
Output h is an array of graphics handles to the
lineobject of each group. - "clr"
defines the color for each group; if not enough colors are defined by
"clr",
See also: scatter.
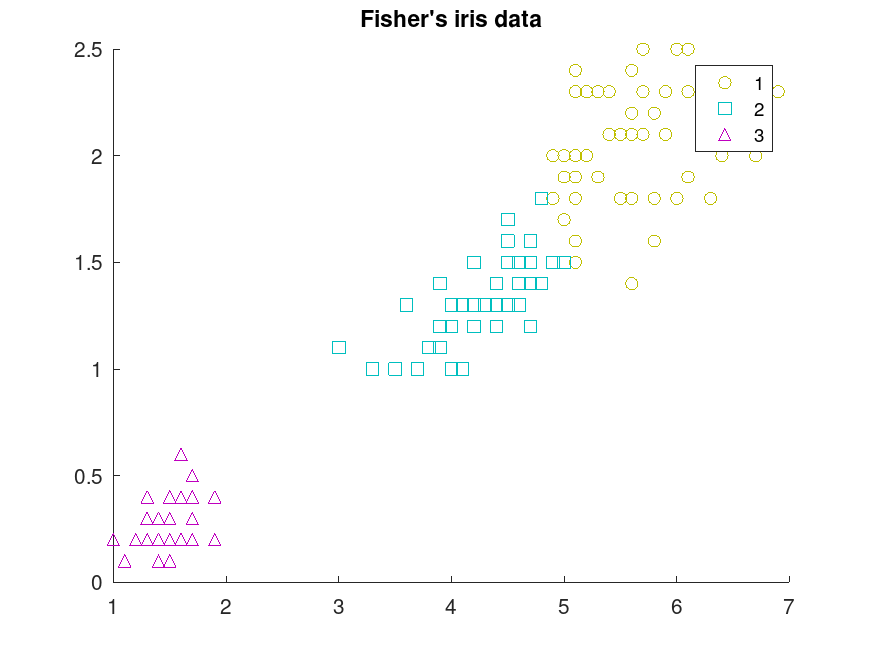
Demonstration 1
The following code
 load fisheriris;
 X = meas(:,3:4);
 cidcs = kmeans (X, 3, "Replicates", 5);
 gscatter (X(:,1), X(:,2), cidcs, [.75 .75 0; 0 .75 .75; .75 0 .75], "os^");
 title ("Fisher's iris data");
Produces the following output
warning: load: '/home/nir/Documents/octave-hg/octave-statistics/target/.installation/statistics-1.4.3/fisheriris.mat' found by searching load path
warning: called from
    get_output at line 50 column 5
    __html_help_text__ at line 67 column 28
    generate_package_html>wrote_html at line 842 column 5
    generate_package_html at line 207 column 7
and the following figure
| Figure 1 |
|---|
 |
Package: statistics