- Function File: hist3 (X)
- Function File: hist3 (X, nbins)
- Function File: hist3 (X,
"Nbins", nbins) - Function File: hist3 (X, centers)
- Function File: hist3 (X,
"Ctrs", centers) - Function File: hist3 (X,
"Edges", edges) - Function File: [N, C] = hist3 (…)
- Function File: hist3 (…, prop, val, …)
- Function File: hist3 (hax, …)
Produce bivariate (2D) histogram counts or plots.
The elements to produce the histogram are taken from the Nx2 matrix X. Any row with NaN values are ignored. The actual bins can be configured in 3 different: number, centers, or edges of the bins:
- Number of bins (default)
Produces equally spaced bins between the minimum and maximum values of X. Defined as a 2 element vector, nbins, one for each dimension. Defaults to
[10 10].- Center of bins
Defined as a cell array of 2 monotonically increasing vectors, centers. The width of each bin is determined from the adjacent values in the vector with the initial and final bin, extending to Infinity.
- Edge of bins
Defined as a cell array of 2 monotonically increasing vectors, edges.
N(i,j)contains the number of elements in X for which:- edges{1}(i) <= X(:,1) < edges{1}(i+1)
- edges{2}(j) <= X(:,2) < edges{2}(j+1)
The consequence of this definition is that values outside the initial and final edge values are ignored, and that the final bin only contains the number of elements exactly equal to the final edge.
The return values, N and C, are the bin counts and centers respectively. These are specially useful to produce intensity maps:
[counts, centers] = hist3 (data);
imagesc (centers{1}, centers{2}, counts)
If there is no output argument, or if the axes graphics handle hax is defined, the function will plot a 3 dimensional bar graph. Any extra property/value pairs are passed directly to the underlying surface object.
See also: hist, histc, lookup, mesh.
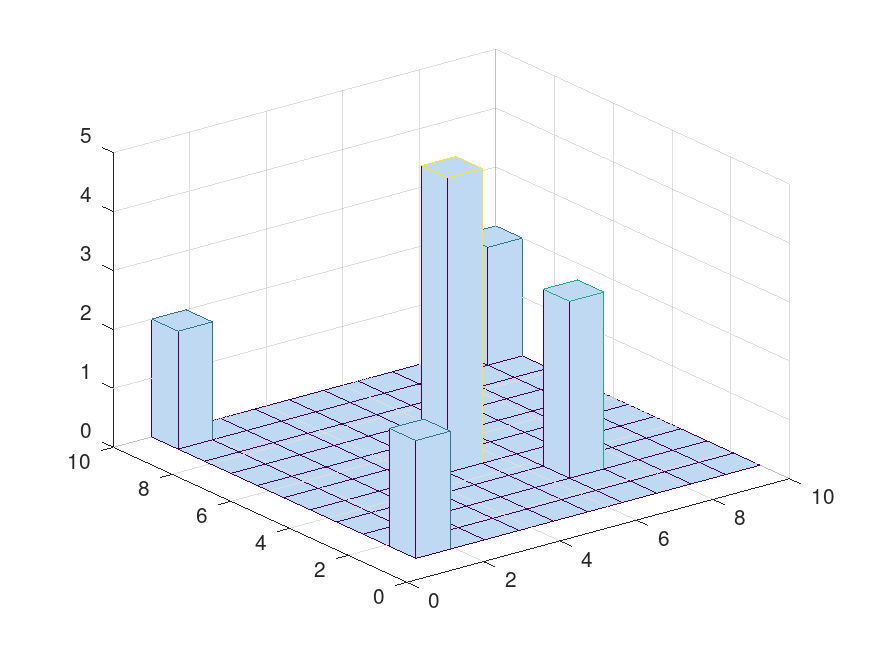
Demonstration 1
The following code
 X = [
    1    1
    1    1
    1   10
    1   10
    5    5
    5    5
    5    5
    5    5
    5    5
    7    3
    7    3
    7    3
   10   10
   10   10];
 hist3 (X)
Produces the following figure
| Figure 1 |
|---|
 |
Package: statistics