- : [idx, centers, sumd, dist] = kmeans (data, k, param1, value1, …)
Perform a k-means clustering of the NxD table data. If parameter
startis specified, then k may be empty in which case k is set to the number of rows of start.The outputs are:
idxAn Nx1 vector whose ith element is the class to which row i of data is assigned.
centersA KxD array whose ith row is the centroid of cluster i.
sumdA kx1 vector whose ith entry is the sum of the distances from samples in cluster i to centroid i.
distAn Nxk matrix whose ijth element is the distance from sample i to centroid j.
The following parameters may be placed in any order. Each parameter must be followed by its value.
StartThe initialization method for the centroids.
plus(Default) The k-means++ algorithm.
sampleA subset of k rows from data, sampled uniformly without replacement.
clusterPerform a pilot clustering on 10% of the rows of data.
uniformEach component of each centroid is drawn uniformly from the interval between the maximum and minimum values of that component within data. This performs poorly and is implemented only for Matlab compatibility.
AA kxDxr matrix, where r is the number of replicates.
ReplicatesAn positive integer specifying the number of independent clusterings to perform. The output values are the values for the best clustering, i.e., the one with the smallest value of sumd. If Start is numeric, then Replicates defaults to (and must equal) the size of the third dimension of Start. Otherwise it defaults to 1.
MaxIterThe maximum number of iterations to perform for each replicate. If the maximum change of any centroid is less than 0.001, then the replicate terminates even if MaxIter iterations have no occurred. The default is 100.
DistanceThe distance measure used for partitioning and calculating centroids.
sqeuclideanThe squared Euclidean distance, i.e., the sum of the squares of the differences between corresponding components. In this case, the centroid is the arithmetic mean of all samples in its cluster. This is the only distance for which this algorithm is truly "k-means".
cityblockThe sum metric, or L1 distance, i.e., the sum of the absolute differences between corresponding components. In this case, the centroid is the median of all samples in its cluster. This gives the k-medians algorithm.
cosine(Documentation incomplete.)
correlation(Documentation incomplete.)
hammingThe number of components in which the sample and the centroid differ. In this case, the centroid is the median of all samples in its cluster. Unlike Matlab, Octave allows non-logical data.
EmptyActionWhat to do when a centroid is not the closest to any data sample.
errorThrow an error.
singleton(Default) Select the row of data that has the highest error and use that as the new centroid.
dropRemove the centroid, and continue computation with one fewer centroid. The dimensions of the outputs centroids and d are unchanged, with values for omitted centroids replaced by NA.
DisplayDisplay a text summary.
off(Default) Display no summary.
finalDisplay a summary for each clustering operation.
iterDisplay a summary for each iteration of a clustering operation.
Example:
[~,c] = kmeans (rand(10, 3), 2, "emptyaction", "singleton");
See also: linkage.
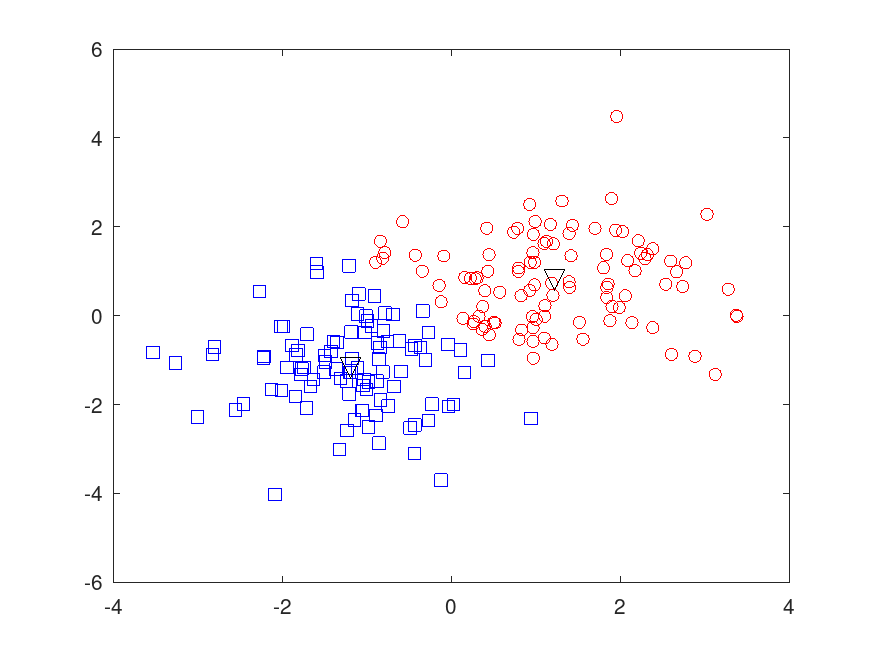
Demonstration 1
The following code
 ## Generate a two-cluster problem
 C1 = randn (100, 2) + 1;
 C2 = randn (100, 2) - 1;
 data = [C1; C2];

 ## Perform clustering
 [idx, centers] = kmeans (data, 2);

 ## Plot the result
 figure;
 plot (data (idx==1, 1), data (idx==1, 2), 'ro');
 hold on;
 plot (data (idx==2, 1), data (idx==2, 2), 'bs');
 plot (centers (:, 1), centers (:, 2), 'kv', 'markersize', 10);
 hold off;
Produces the following figure
| Figure 1 |
|---|
 |
Package: statistics