- Function File: [si, h] = silhouette (X, clust)
- Function File: [si, h] = silhouette (…, Metric, MetricArg)
-
Compute the silhouette values of clustered data and show them on a plot.
X is a n-by-p matrix of n data points in a p-dimensional space. Each datapoint is assigned to a cluster using clust, a vector of n elements, one cluster assignment for each data point.
Each silhouette value of si, a vector of size n, is a measure of the likelihood that a data point is accurately classified to the right cluster. Defining "a" as the mean distance between a point and the other points from its cluster, and "b" as the mean distance between that point and the points from other clusters, the silhouette value of the i-th point is:
         bi - ai
Si =  ------------
       max(ai,bi)
Each element of si ranges from -1, minimum likelihood of a correct classification, to 1, maximum likelihood.
Optional input value Metric is the metric used to compute the distances between data points. Since
silhouetteusespdistto compute these distances, Metric is quite similar to the option Metric of pdist and it can be:- A known distance metric defined as a string:
Euclidean,sqEuclidean(default),cityblock,cosine,correlation,Hamming,Jaccard. - A vector as those created by
pdist. In this case X does nothing. - A function handle that is passed to
pdistwith MetricArg as optional inputs.
Optional return value h is a handle to the silhouette plot.
Reference Peter J. Rousseeuw, Silhouettes: a Graphical Aid to the Interpretation and Validation of Cluster Analysis. 1987. doi:10.1016/0377-0427(87)90125-7
- A known distance metric defined as a string:
See also: dendrogram, evalcluster, kmeans, linkage, pdist.
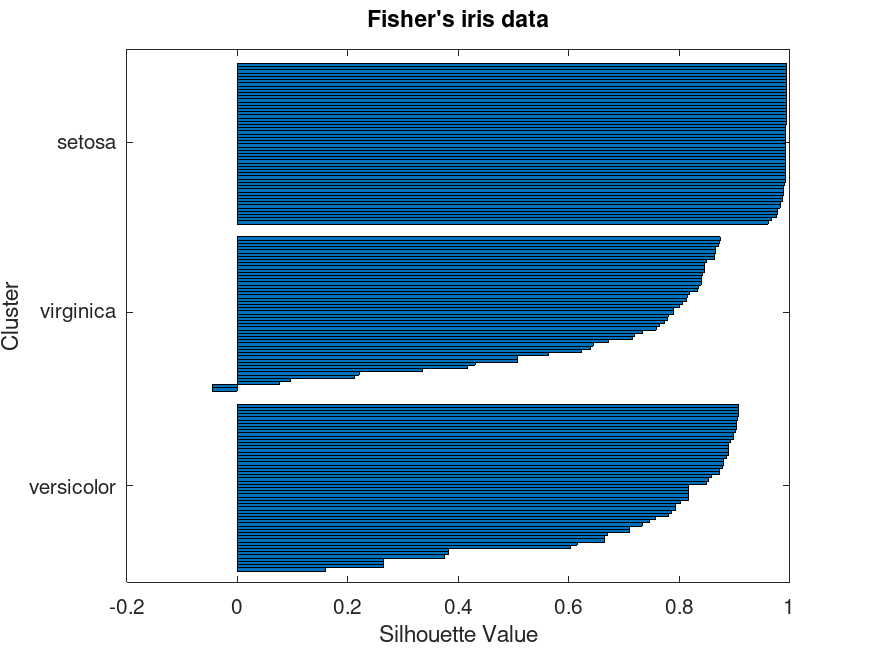
Demonstration 1
The following code
 load fisheriris;
 X = meas(:,3:4);
 cidcs = kmeans (X, 3, "Replicates", 5);
 silhouette (X, cidcs);
 y_labels(cidcs([1 51 101])) = unique (species);
 set (gca, "yticklabel", y_labels);
 title ("Fisher's iris data");
Produces the following output
warning: load: '/home/nir/Documents/octave-hg/octave-statistics/target/.installation/statistics-1.4.3/fisheriris.mat' found by searching load path
warning: called from
    get_output at line 50 column 5
    __html_help_text__ at line 67 column 28
    generate_package_html>wrote_html at line 842 column 5
    generate_package_html at line 207 column 7
and the following figure
| Figure 1 |
|---|
 |
Package: statistics