- Function File:
output =av_d2(d2_c2d_c1_out)¶ - Function File:
output =av_d2(d2_c2d_c1_out, paramName, paramValue, …)¶ -
This program takes the output of d2, c2d or c1 and smooths it by averaging over a given interval. It is also possible to specify the range of embedding dimensions to be smoothed. This function makes most sense for the "d2" field of the d2 output or the output of c2d. By default it only smooths field "d2" of the d2 output.
Assuming the two column vectors of a matrix (one of the fields of the input struct) are r and d then one of the output matrices will be of the form:
 _                              _
|                 __ a          |
|           1    \              |
|  r    ,  ----   |      d     |
|_   i      2a+1  /__ j=-a  i-j _|
Input
The input needs to be the output of d2, c2d or c1.
Parameters
- mindim
Minimum dimension to smooth, this also determines the size of the output struct [default = 1].
- maxdim
Maximum dimension to smooth (also determines size of output struct) [default = 1].
- a
Smooth over an interval of
2 * a + 1points [default = 1].
Switch
- smoothall
This switch makes only works for inputs that were generated by d2. If this switch is set all of the fields of the input are smoothed and not just field "d2".
Output
The output is a struct array, which is a subarray of the input. The indexes used to create the subarray are mindim:maxdim. Some or all of the fields of this output have been smoothed (depending on the smoothall switch).
See also: demo av_d2, d2, c2t, c2g.
Algorithms
The algorithms for this functions have been taken from the TISEAN package.
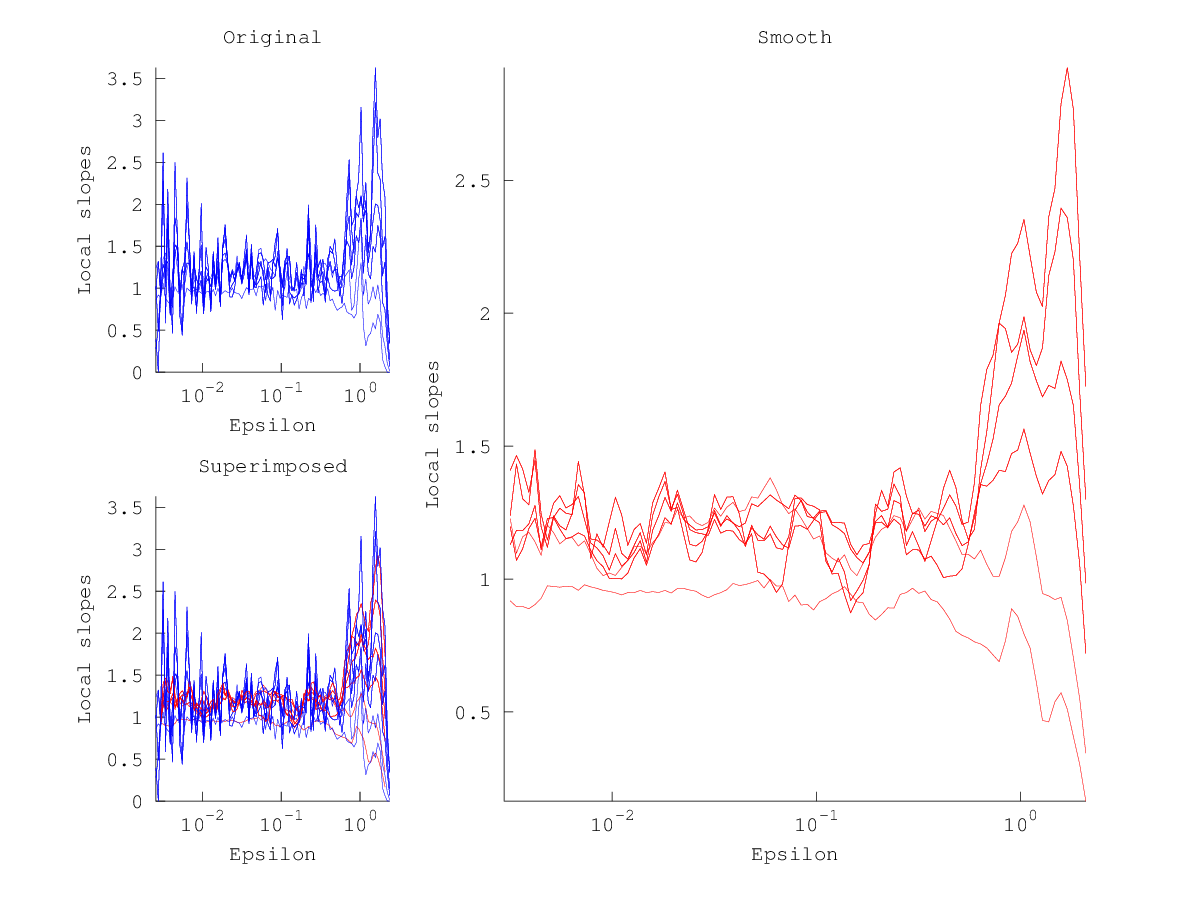
Demonstration 1
The following code
 vals = d2 (henon (1000), 'd', 1, 't', 50, 'm', 5);

 subplot (2,3,1)
 do_plot_slope = @(x) semilogx (x{1}(:,1),x{1}(:,2),'b');
 hold on
 arrayfun (do_plot_slope, {vals.d2});
 hold off
 axis tight
 xlabel ("Epsilon")
 ylabel ("Local slopes")
 title ("Original");

 smooth = av_d2 (vals,'a',2);

 subplot (2,3,4)
 do_plot_slope = @(x,y) semilogx (x{1}(:,1),x{1}(:,2),'r',...
                                  y{1}(:,1),y{1}(:,2),'b');
 hold on
 arrayfun (do_plot_slope, {smooth.d2}, {vals.d2}  );
 hold off
 axis tight
 xlabel ("Epsilon")
 ylabel ("Local slopes")
 title ("Superimposed");

 subplot (2,3,[2 3 5 6])
 do_plot_slope = @(x) semilogx (x{1}(:,1),x{1}(:,2),'r');
 hold on
 arrayfun (do_plot_slope, {smooth.d2});
 hold off
 axis tight
 xlabel ("Epsilon")
 ylabel ("Local slopes")
 title ("Smooth");
Produces the following figure
| Figure 1 |
|---|
 |
Package: tisean