- Function File:
output =c1(S)¶ - Function File:
output =c1(S, paramName, paramValue, …)¶ -
Computers curves for the fixed mass computation of information dimension (mentioned in TISEAN 3.0.1 documentation).
A logarithmic range of masses between 1/N and 1 is realised by varying the neighbour order k as well as the subsequence length n. For a given mass k/n, n is chosen as small is possible as long as k is not smaller than the value specified by parameter k .
You will probably use the auxiliary functions c2d or c2t to process the output further. The formula used for the Gaussian kernel correlation sum does not apply to the information dimension.
Input
- S
This function always assumes that each time series is along the longer dimension of matrix S. It also assumes that every dimension (counting along the shorter dimension) of S is considered a component of the time series.
Parameters
- mindim
The minimum embedding dimension [default = 1].
- maxdim
The maximum embedding dimension [default = 10].
- d
The delay used [default = 1].
- t
Minimum time separation [default = 0].
- n
The number of reference points. That number of points are selected at random from all time indices [default = 100].
- res
Resolution, values per octave [default = 2].
- i
Seed for the random numbers [use default seed].
- k
Maximum number of neighbors [default = 100].
Switch
- verbose
Display information about current mass during execution.
Output
The output is a maxdim - mindim + 1 x 1 struct array with the following fields:
- dim
The embedding dimension of the struct.
- c1
A matrix with two collumns that contain the following data:
- radius
- ’mass’
See also: demo c1, c2d, c2t.
Algorithms
The algorithms for this functions have been taken from the TISEAN package.
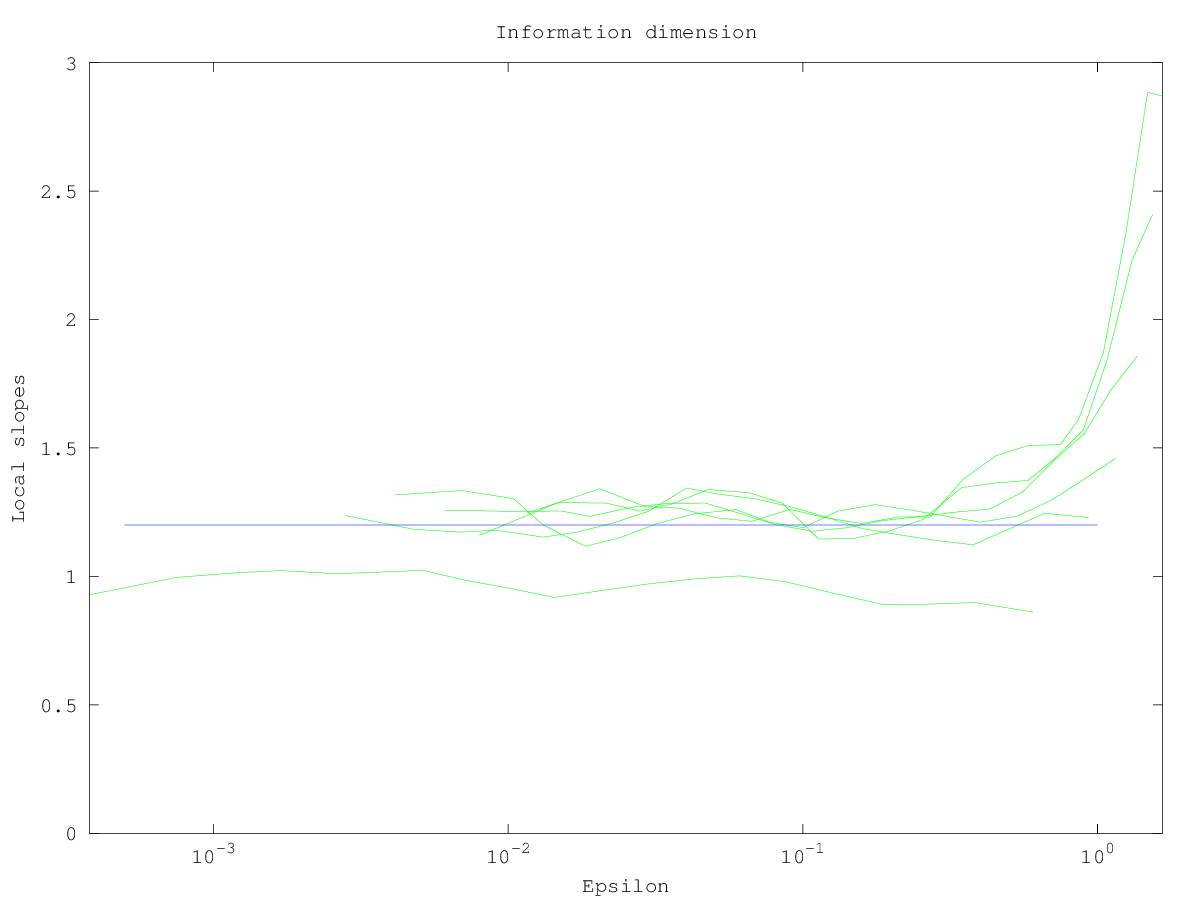
Demonstration 1
The following code
 res   = c1 (henon (5000)(:,1), 'd', 1, 'maxdim', 6, 't',50, 'n', 500);
 slope = c2d (res, 2);

 do_plot_c1  = @(x) semilogx (x{1}(:,1),x{1}(:,2),'g');
 hold on
 arrayfun (do_plot_c1, {slope.d});
 plot ([5e-4 1],[1.2 1.2])
 hold off
 axis tight
 ylim ([0 3]);
 xlabel ("Epsilon")
 ylabel ("Local slopes");
 title ("Information dimension")
Produces the following figure
| Figure 1 |
|---|
 |
Package: tisean