- Function File:
[values, pars] =d2(S)¶ - Function File:
[values, pars] =d2(S, paramName, paramValue, …)¶ -
This program estimates the correlation sum, the correlation dimension and the correlation entropy of a given, possibly multivariate, data set. It uses the box assisted search algorithm and is quite fast as long as one is not interested in large length scales. All length scales are computed simultaneously and the current center and epsilon are written every 2 min (real time, not cpu time) or every set number of center value increases. It is possible to set a maximum number of pairs. If this number is reached for a given length scale, the length scale will no longer be treated for the rest of the estimate.
Input
- S
This function always assumes that each time series is along the longer dimension of matrix S. It also assumes that every dimension (counting along the shorter dimension) of S is considered a component of the time series.
Parameters
- m
The maximum embedding dimension [default = 10].
- d
The delay used [default = 1].
- t
Theiler window [default = 0].
- rlow
Minimum length scale [default = 1e-3].
- rhigh
Maximum length scale [default = 1].
- eps_no
Number of length scale values [default = 100].
- n
Maximum number of pairs to be used (value 0 means all possible pairs) [default = 1000].
- p
This parameter determines after how many iterations (center points) should the program pause and write out how many center points have been treated so far and the current epsilon. If plot_corr or plot_slopes or plot_entrop is set then during the pause a plot of the current state of c2, d2 or h2 (respectively) is produced. Regardless of the value of this parameter the program will pause every two minutes [default = only pause every 2 minutes].
Switches
- normalized
When this switch is set the program uses data normalized to [0,1] for all components.
- plot_corr
If this switch is set then whenever the execution is paused (the frequency can be set with parameter p) the most recent correlation sums are plotted. The color used for them is blue.
- plot_slopes
Same as plot_corr except the plotted values are the local slopes. They are plotted in red.
- plot_entrop
Same as plot_corr except the correlation entropies are plotted. They are plotted in green.
Output
- values
This is a struct array that contains the following fields:
- dim - the dimension of the data
- c2 - the first column is the epsilon and the second the correlation sums for a particular embedding dimension
- d2 - the first column is the epsilon and the second the local slopes of the logarithm of the corrlation sum
- h2 - the first column is the epsilon and the second the correlation entropies
- pars
This is a struct. It contains the following fields:
- treated - the number of center points treated
- eps - the maximum epsilon used
See also: demo d2, av_d2, c2t, c2g.
Algorithms
The algorithms for this functions have been taken from the TISEAN package.
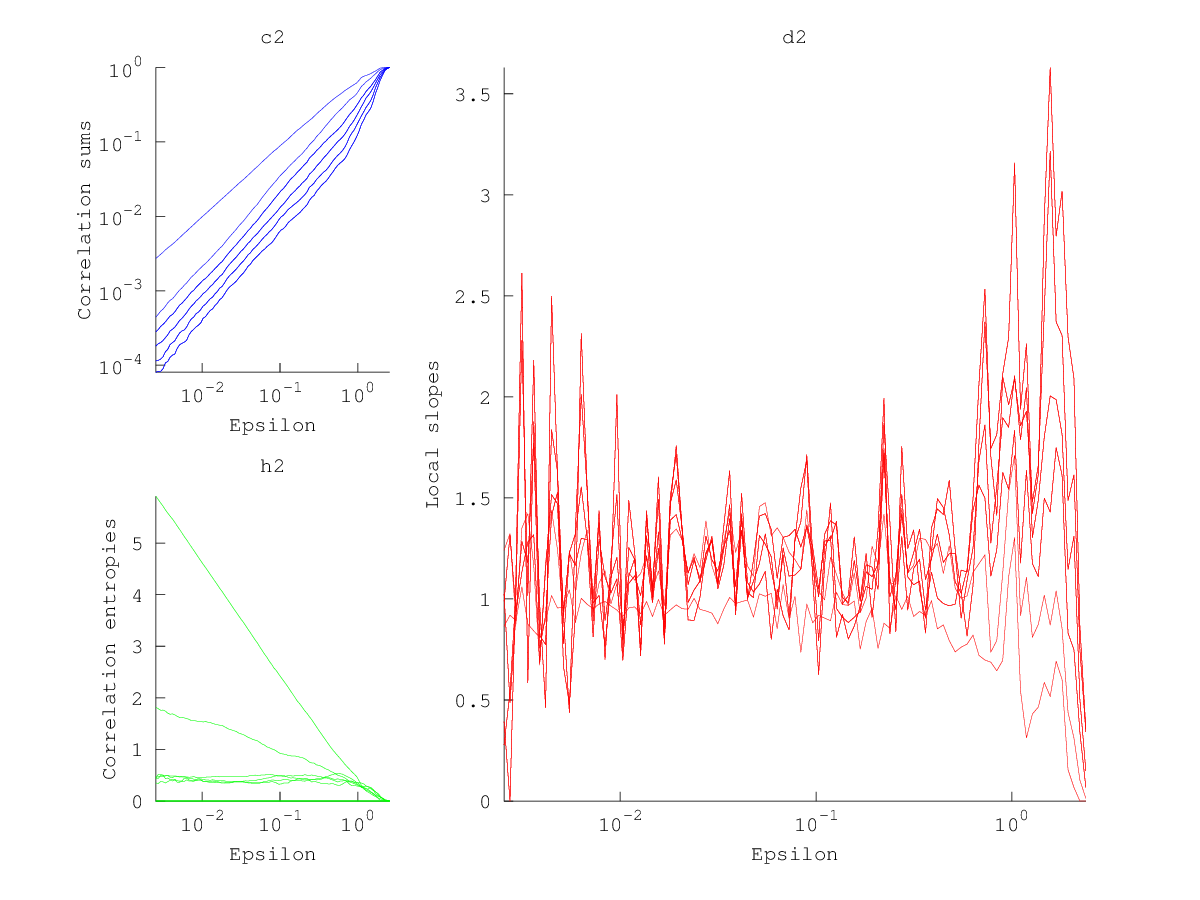
Demonstration 1
The following code
 vals = d2 (henon (1000), 'd', 1, 'm', 5, 't',50);

 subplot (2,3,1)
 do_plot_corr  = @(x) loglog (x{1}(:,1),x{1}(:,2),'b');
 hold on
 arrayfun (do_plot_corr, {vals.c2});
 hold off
 axis tight
 xlabel ("Epsilon")
 ylabel ("Correlation sums")
 title ("c2");

 subplot (2,3,4)
 do_plot_entrop  = @(x) semilogx (x{1}(:,1),x{1}(:,2),'g');
 hold on
 arrayfun (do_plot_entrop, {vals.h2});
 hold off
 axis tight
 xlabel ("Epsilon")
 ylabel ("Correlation entropies");
 title ("h2")

 subplot (2,3,[2 3 5 6])
 do_plot_slope = @(x) semilogx (x{1}(:,1),x{1}(:,2),'r');
 hold on
 arrayfun (do_plot_slope, {vals.d2});
 hold off
 axis tight
 xlabel ("Epsilon")
 ylabel ("Local slopes")
 title ("d2");
Produces the following figure
| Figure 1 |
|---|
 |
Package: tisean