- Function File:
output =ghkss(S)¶ - Function File:
output =ghkss(S, paramName, paramValue, …)¶ -
Multivariate noise reduction using the GHKSS algorithm.
Input
- S
This function always assumes that each time series is along the longer dimension of matrix S. It also assumes that every dimension (counting along the shorter dimension) of S is considered a component of the time series.
Parameters
- m
The embedding dimension used. It is synonymous to the second part of flag ’-m’ from TISEAN. The first part of the TISEAN flag is omitted as all of the available components of S are analyzed. [default = 1].
- d
The delay for the embedding [default = 1].
- q
Dimension of the manifold to project to [default = 2].
- k
Minimal number of neighbours [default = 50].
- r
Minimal size of neighbourhood [default = 1/1000].
- i
Number of iterations [default = 1].
Switches
- euclidean
When this switch is selected the function will use the euclidean metric instead of the tricky one.
- verbose
If this switch is selected the function will give progress reports along the way. Those include the average correction, trend and how many points were corrected for which epsilon.
Output
The output contains the cleaned time series. The output is of the same size as the input.
Algorithms
The algorithms for this functions have been taken from the TISEAN package.
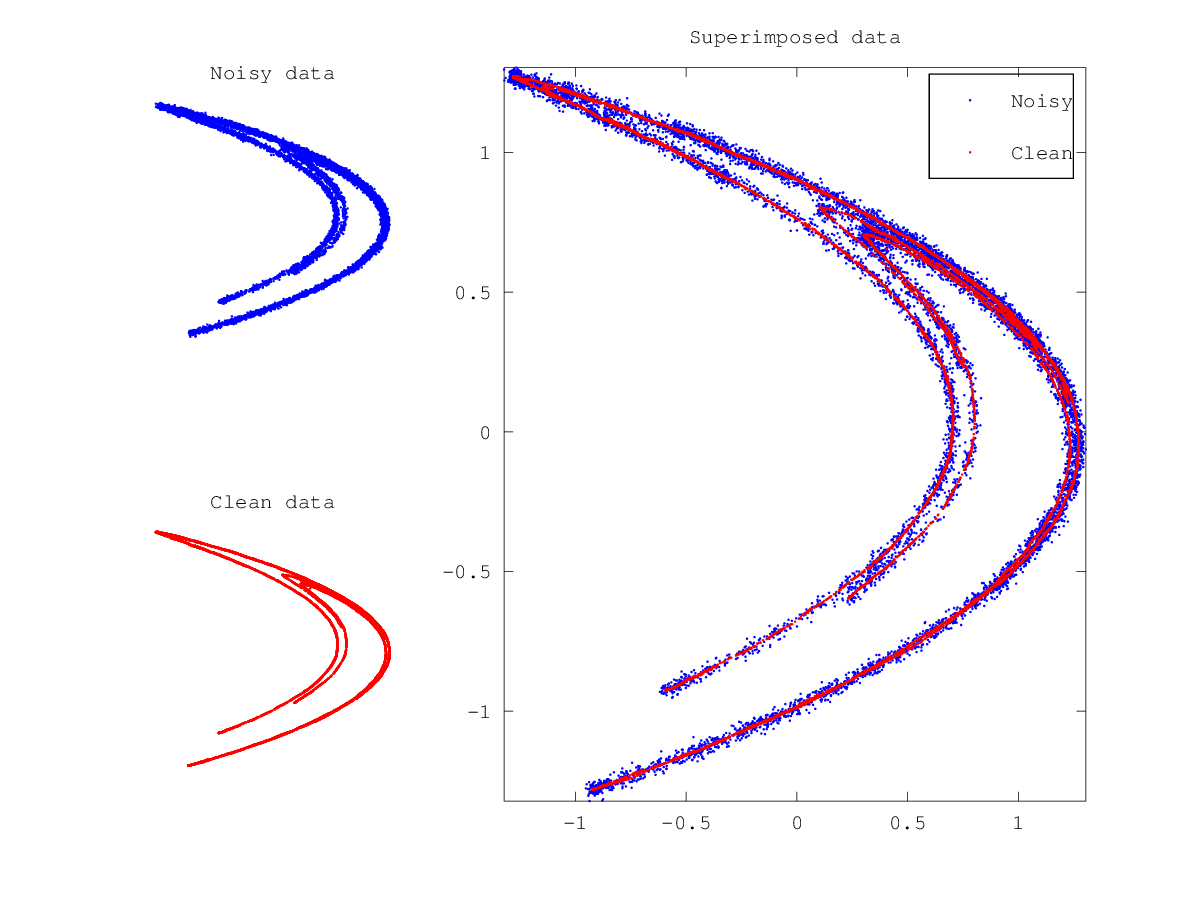
Demonstration 1
The following code
 hen    = henon (10000);
 # The following line is equvalent to 'addnoise -v0.02 hen' from TISEAN
 hen    = hen + std (hen) * 0.02 .* (-6 + sum (rand ([size(hen), 12]), 3));
 hendel = delay (hen(:,1));
 hengk = ghkss (hen(:,1),'m',7,'q',2,'r',0.05,'k',20,'i',2);
 hengk = delay (hengk);

 subplot (2,3,1)
 plot (hendel(:,1), hendel(:,2), 'b.','markersize', 3);
 title ("Noisy data");
 pbaspect ([1 1 1]);
 axis tight
 axis off

 subplot (2,3,4)
 plot (hengk(:,1), hengk(:,2),'r.','markersize', 3);
 title ("Clean data");
 pbaspect ([1 1 1]);
 axis tight
 axis off

 subplot (2,3,[2 3 5 6])
 plot (hendel(:,1), hendel(:,2), 'b.','markersize', 3,...
       hengk(:,1), hengk(:,2),'r.','markersize', 3);
 legend ("Noisy", "Clean");
 title ("Superimposed data");
 axis tight
Produces the following figure
| Figure 1 |
|---|
 |
Package: tisean