- Function File:
output =lyap_k(X)¶ - Function File:
output =lyap_k(X, paramName, paramValue, …)¶ -
Estimates the maximum Lyapunov exponent using the algorithm described by Kantz on the TISEAN reference page:
http://www.mpipks-dresden.mpg.de/~tisean/Tisean_3.0.1/docs/chaospaper/citation.html
Input
- X
Must be realvector.
Parameters
- mmax
Maximum embedding dimension to use [default = 2].
- mmin
Minimum embedding dimension to use [default = 2].
- d
Delay used [default = 1].
- rlow
Minimum length scale to search neighbors [default = 1e-3].
- rhigh
Maximum length scale to search neighbors [default = 1e-2].
- ecount
Number of length scales to use [default = 5].
- n
Reference points to use [all].
- s
Number of iterations in time [default = 50].
- t
’theiler window’ [default = 0].
Switch
- verbose
Prints information about the current length scale at runtime.
Output
The output is a struct array of size:
'ecount' x ('mmax' - 'mmin' + 1)It has the following fields:
eps- holds the epsilon for the exponentdim- holds the embedding dimension used in exponentexp- contains the exponent data. It consists of 3 columns:- The number of the iteration
- The logarithm of the stretching factor (the slope is the Laypunov exponent if it is a straight line)
- The number of points for which a neighborhood with enough points was found
See also: demo lyap_k, lyap_r, lyap_spec.
Algorithms
The algorithms for this functions have been taken from the TISEAN package.
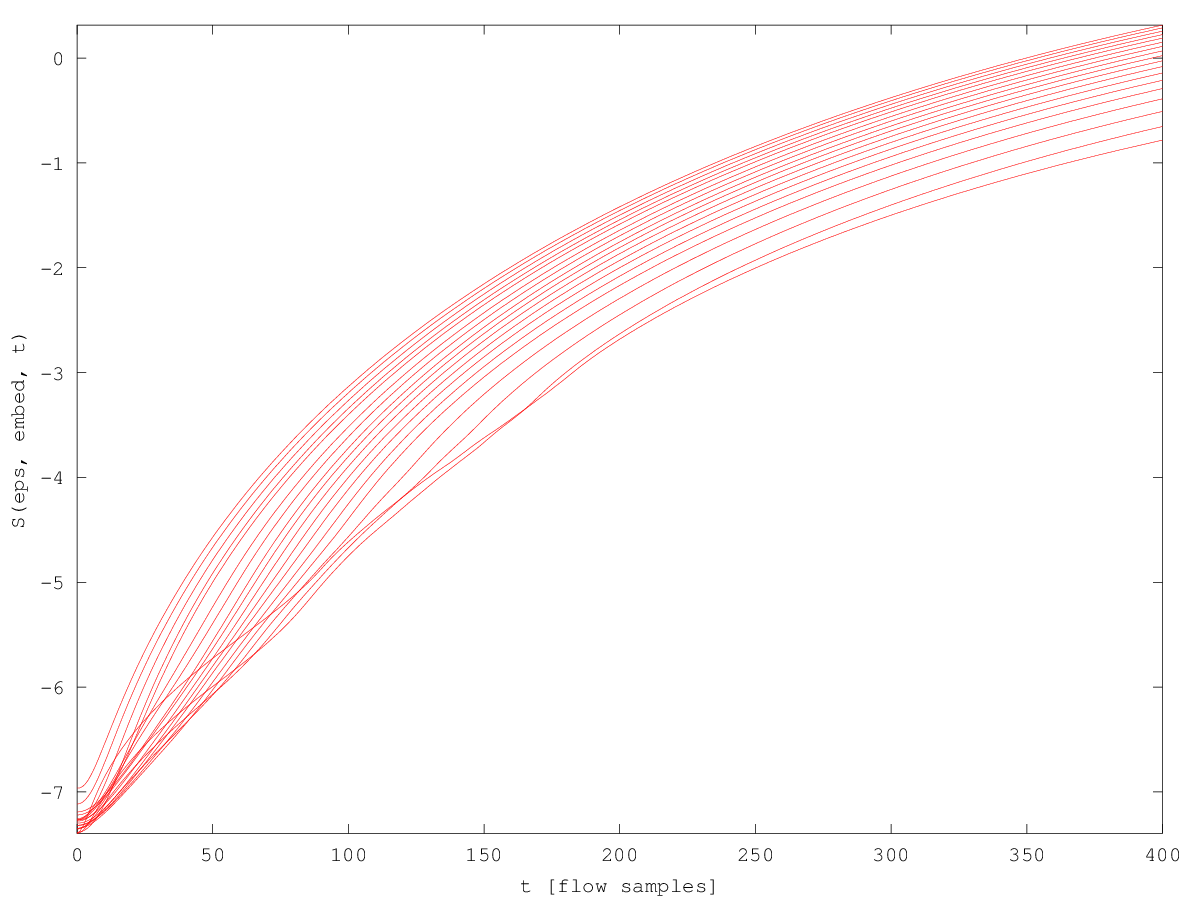
Demonstration 1
The following code
 idx    = (1:2500).';
 in     = sin (idx./360) + cos (idx ./ 180);
 mmax   = 20;
 res    = lyap_k (in, 'mmin',2,'mmax',mmax,'d',6,'s',400,'t',500);

 cla reset
 hold on
 for j=2:mmax
   plot (res(1,j-1).exp(:,1),res(1,j-1).exp(:,2),'r');
 endfor
 axis tight
 xlabel ("t [flow samples]");
 ylabel ("S(eps, embed, t)");
 hold off
Produces the following figure
| Figure 1 |
|---|
 |
Package: tisean