- Function File:
output =lzo_run(S)¶ - Function File:
output =lzo_run(S, paramName, paramValue, …)¶ -
This program fits a locally zeroth order model to a possibly multivariate time series and iterates the time series into the future. The existing data set is extended starting with the last point in time. It is possible to add gaussian white dynamical noise during the iteration.
Input
- S
This function always assumes that each time series is along the longer dimension of matrix S. It also assumes that every dimension (counting along the shorter dimension) of S is considered a component of the time series.
Parameters
- m
The embedding dimension used. It is synonymous to the second part of flag ’-m’ from TISEAN. The first part of the TISEAN flag is omitted as all of the available components of S are analyzed [default = 1].
- d
Delay used for the embedding [default = 1].
- L
Number of iterations into the future [default = 1000].
- k
Minimal number of neighbors for the fit [default = 50].
- dnoise
Add dynamical noise as percentage of the variance, this value is given in percentage. The same as flag ’-%’ from TISEAN [default = no noise (0)].
- i
Seed for the random number generator used to add noise. If set to 0 the time command is used to create a seed [default = 0x9074325].
- r
Neighborhood size to start with [default = 1e-3].
- f
Factor to increase neighborhood size if not enough neighbors were found [default = 1.2].
Switch
- onlynearest
If this switch is set then the program uses only the nearest k neighbor found. This is synonymous with flag ’-K’ from TISEAN.
Output
Components of the forecasted time series.
See also: demo lzo_run, lzo_test, lzo_gm.
Algorithms
The algorithms for this functions have been taken from the TISEAN package.
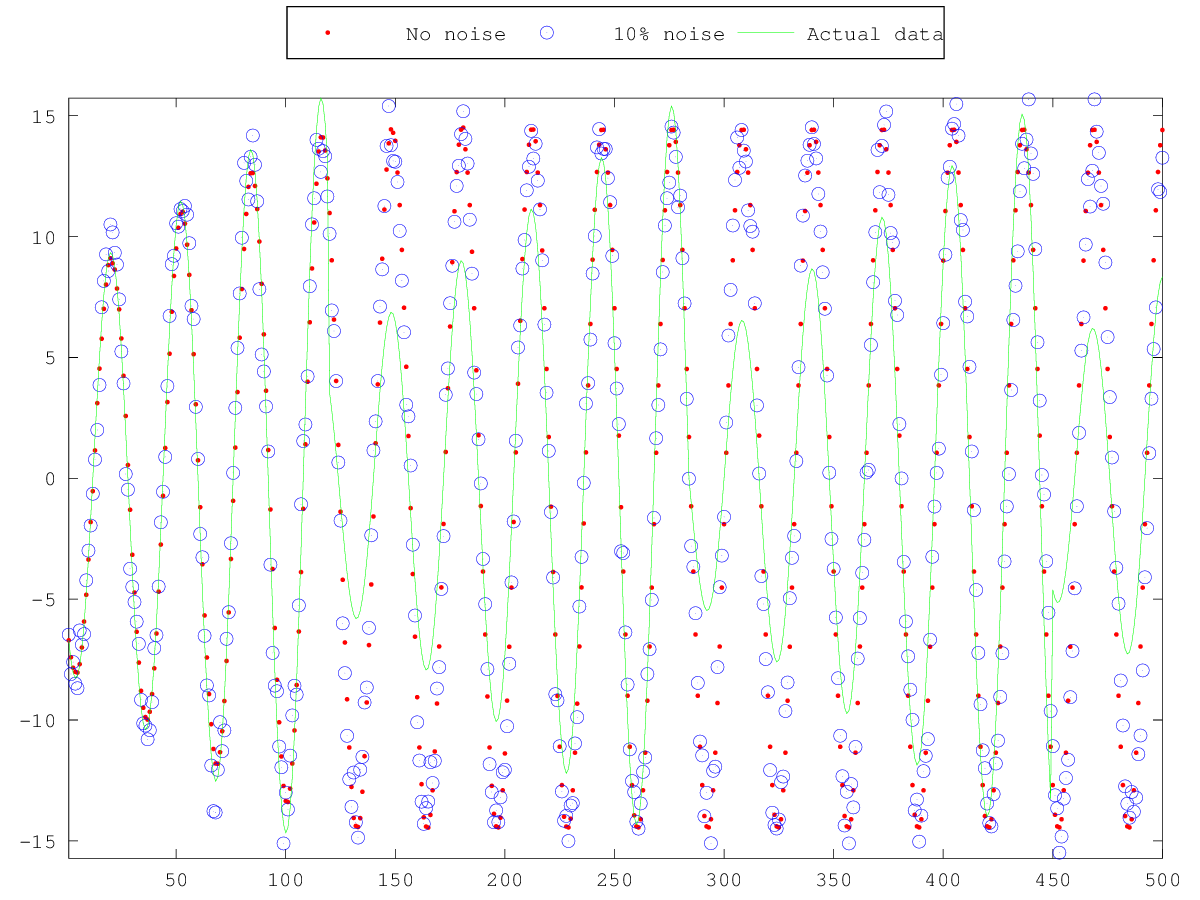
Demonstration 1
The following code
 idx = 1:5000;
 sin_saw = (5 + mod (idx, 165) ./15) .* sin (idx.* 2 * pi /32);
 sin_saw = sin_saw.';
 no_noise = lzo_run (sin_saw(1:4500), 'm',4,'d',6,'l',500);
 noisy    = lzo_run (sin_saw(1:4500), 'm',4,'d',6, 'dnoise',10,'l',500);
 plot (no_noise, 'r.', noisy, 'bo',sin_saw(4501:end),'g');
 legend ("No noise",...
         "10% noise",...
         "Actual data");
 legend ("Location", "NorthOutside", "Orientation", "Horizontal");
 axis tight
Produces the following figure
| Figure 1 |
|---|
 |
Package: tisean