- Function File:
[par, forecast] =rbf(X)¶ - Function File:
[par, forecast] =rbf(X, paramName, paramValue, …)¶ -
This program models the data using a radial basis function (rbf) ansatz. The basis functions used are gaussians, with center points chosen to be data from the time series. If the ’DriftOff’ switch is not set, a kind of Coulomb force is applied to them to let them drift a bit in order to distribute them more uniformly. The variance of the gaussians is set to the average distance between the centers. This program either tests the ansatz by calculating the average forecast error of the model, or makes a i-step prediction using the -L flag, additionally. The ansatz made is:
x_n+1 = a_0 SUM a_i * f_i(x_n)
where x_n is the nth delay vector and f_i is a gaussian centered at the ith center point.
Input
- X
Must be realvector. The output will be alligned with the input.
Parameters
- m
The embedding dimension. Synonymous with flag ’-m’ from TISEAN [default = 2].
- d
Delay used for embedding [default = 1].
- p
Number of centers [default = 10].
- s
Steps to forecast (for the forecast error) [default = 1].
- n
Number of points for the fit. The other points are used to estimate the out of sample error [default = length (X)].
- l
Determines the length of the predicted series [default = 0].
Switch
- DriftOff
Deactivates the drift (Coulomb force), which is otherwise on.
Output
- pars
This structure contains parameters used for the fit. It has the following fields:
- centers - contains coordinates of the center points
- var - variance used for the gaussians
- coeffs - contains the coefficients (weights) of the basis functions used for the model
- err - err(1) is the in sample error, and err(2) is the out of sample error (if it exists)
- forecast
Contains the forecasted points. It’s length is equal to the value of parameter l
Algorithms
The algorithms for this functions have been taken from the TISEAN package.
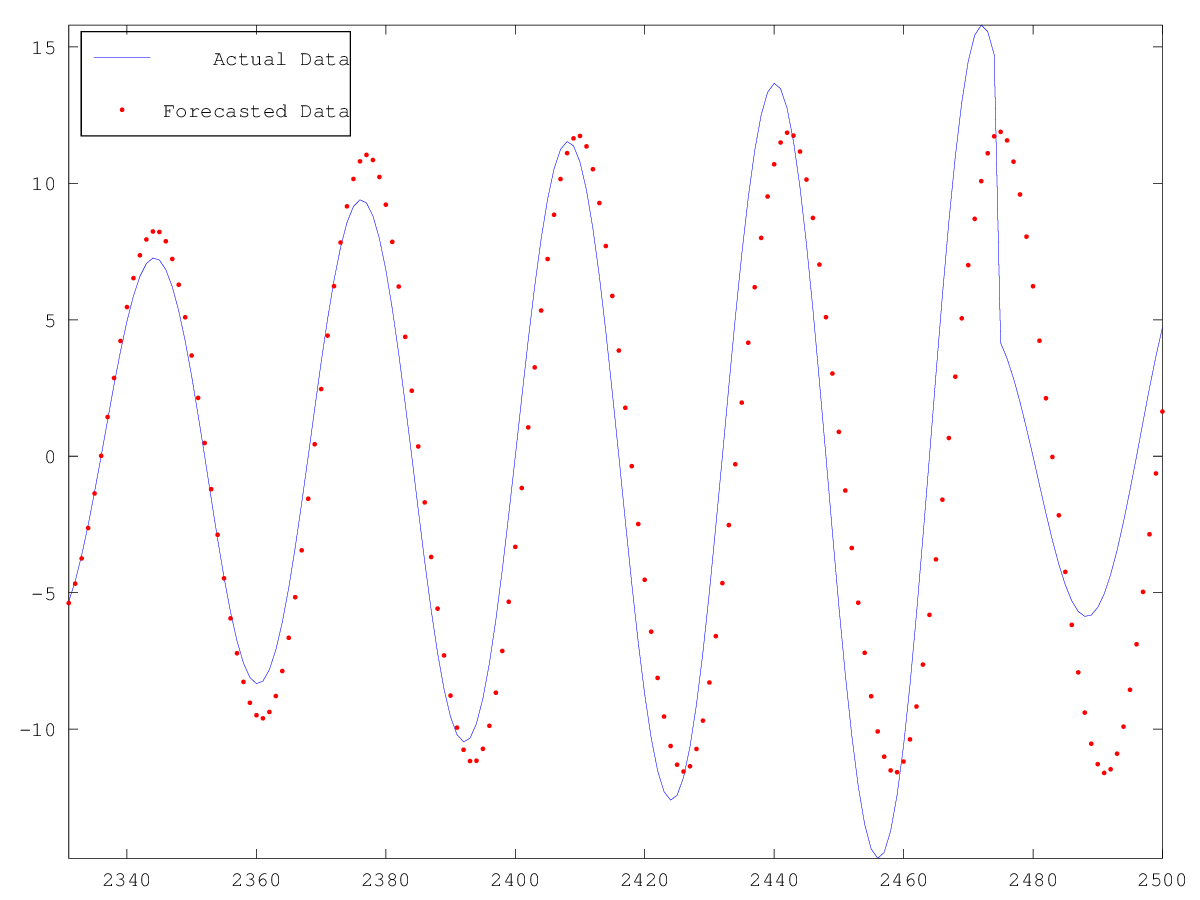
Demonstration 1
The following code
 # sin_saw is a sinusoid multiplied by a saw function
 idx = (1:2500).';
 sin_saw = (5 + mod (idx, 165) ./15) .* sin (idx.* 2 * pi /32);

 forc_no = 170; #Number of forecasted points
 [p,forecast]  = rbf (sin_saw(1:end-forc_no), 'm', 2, 'd', 6, 'p',12,...
                          'n',length(idx)-forc_no, 'l',forc_no);
 plot (idx(end-forc_no+1:end), sin_saw(end-forc_no+1:end),'b',...
       idx(end-forc_no+1:end), forecast,'r.')
 legend ('Actual Data', 'Forecasted Data')
 legend ('Location','NorthWest')
 axis tight
Produces the following figure
| Figure 1 |
|---|
 |
Package: tisean