- Function File:
[surro_data, pars] =surrogates(S)¶ - Function File:
[surro_data, pars] =surrogates(S, paramName, paramValue, …)¶ -
Generates multivariate surrogate data (implements the iterative Fourier scheme). Surrogate data is generated from a dataset with the aim of testing whether the dataset was generated by a given process (null hypothesis). The Fourier scheme assumes that the dataset is the output of a Gaussian linear stochastic process. Surrogate data is generally used to test the null hypothesis.
Input
- S
This function always assumes that each time series is along the longer dimension of matrix S. It also assumes that every dimension (counting along the shorter dimension) of S is considered a component of the time series. It’s length must be factorizable by only 2, 3 and 5. If not the largest submatrix that fulfills this requirement will be used. The function
endtoendcan be used to determine what is the best submatrix for the data and then sending only that submatrix to this program. Padding with zeros is not and option.
Parameters
- n
Sets the number of surrogates to be calculated. Determines the form of the output (see Output section) [default = 1].
- i
The maximum number of permutations. Value ’0’ yields random permutations or if switch exact is set an unrescaled FFT surrogate. Value ’1’ is a surrogate close to the result of the AAFT procedure, but not quite the same. Value ’-1’ means the program will perform iterations until there is no change between them [default = -1].
- seed
Set the seed for the random generator [default = use default seed].
Switch
- exact
This switch makes the spectrum of the output exact rather than a distribution.
Outputs
- surro_data
If parameter
n == 1then this is a matrix that holds the surrogate data. If parametern > 1then it is n x 1 cell array of matrixes with the data. In both cases the matrixes themselves are alligned with the input.- pars
This is a matrix of size n x 2 (if the input components were column vectors, otherwise transposed). The first column contains the number of iteration it took to generate the i-th surrogate, whereas the second column is the relative discrepency for the i-th surrogate.
See also: demo surrogates, endtoend.
Algorithms
The algorithms for this functions have been taken from the TISEAN package.
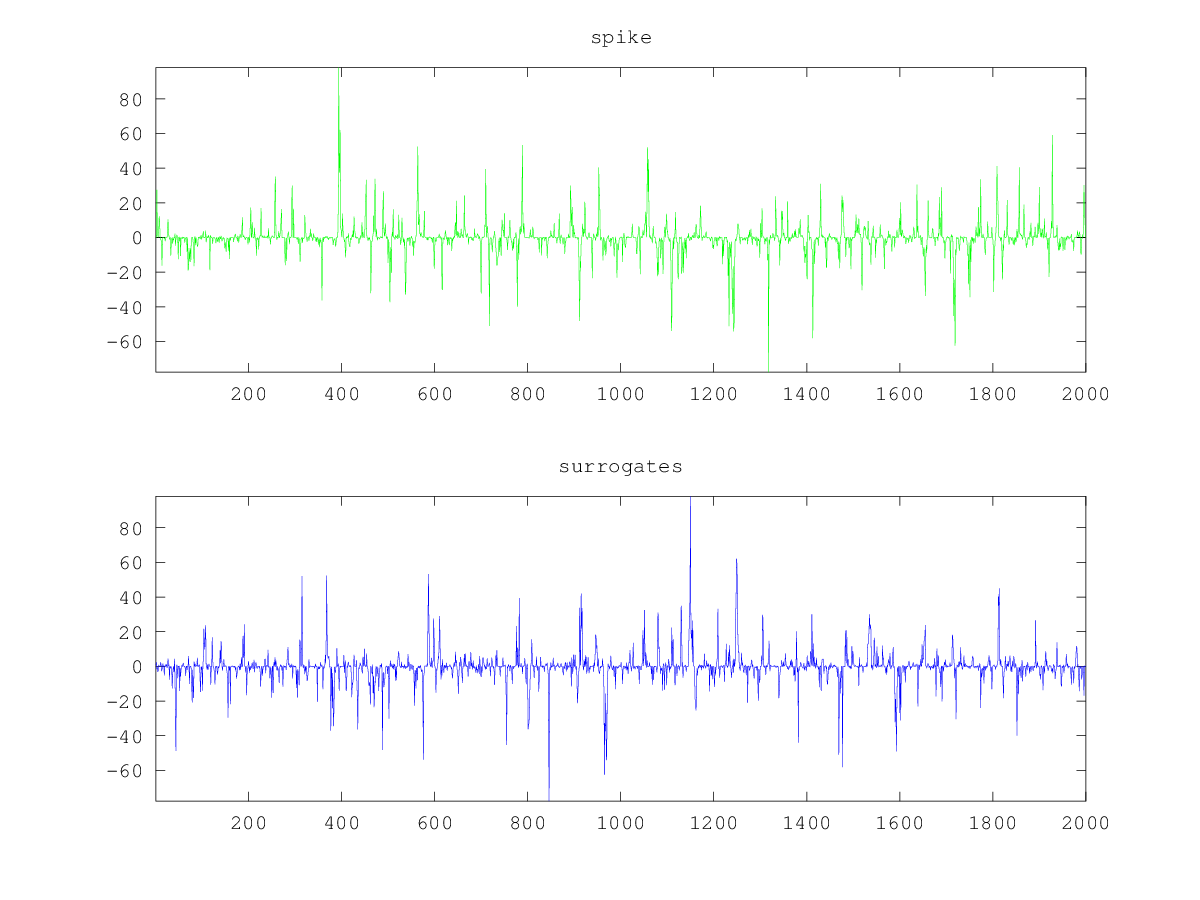
Demonstration 1
The following code
 x = zeros (2000,1);
 for i = 2:2000
   x(i) = 0.7*x(i-1) +  (-6 + sum (rand ([size(1), 12]), 3));
 endfor

 # 'spike' is the process above measured s_n (x_n) = x_n^3.
 spike = x.^3;

 # Plot the data
 subplot (2,1,1)
 plot (spike,'g');
 axis tight
 title ("spike")
 subplot (2,1,2)
 plot (surrogates(spike),'b');
 axis tight
 title ("surrogates")
Produces the following figure
| Figure 1 |
|---|
 |
Package: tisean