
|
Octave-Forge - Extra packages for GNU Octave |
| Home · Packages · Developers · Documentation · FAQ · Bugs · Mailing Lists · Links · Code |
|
|
Octave-Forge - Extra packages for GNU Octave |
| Home · Packages · Developers · Documentation · FAQ · Bugs · Mailing Lists · Links · Code |
Interpret the level-set function phi and extract geometrical properties. A rectangular grid with spacing h uniform in each dimension is assumed. This function assumes the 2D situation.
The function assumes that phi does not contain values which are
exact zeros. It is a good idea to use ls_normalise before
calling ls_find_geometry.
Intersection points with edges very
close to a grid point may be pushed away from it, governed
by fractol.
The following terms will be used to denote certain elements of the geometrical description returned by this function:
A point on the grid. phi is the value of the level-set function at each node. They are numbered from 1 to l x m in the same way as the entries in the matrix phi are numbered.
One rectangular cell of the grid. Since we work in 2D, each element is made up of four nodes (which are the vertices of the rectangle). If the grid has l x m nodes, then it contains (l - 1) x (m - 1) elements.
An element for which each node is inside the described domain.
An element for which each node is outside of the described domain.
An element which has both inside and outside nodes. These elements are intersected by the boundary of the domain and have intersection points on some of their edges.
It can be the case that it has two intersection points (when one boundary edge intersects it) or four (if we have a “narrow pair”). The latter case is that of two intersecting (parallel) boundary edges, which happens when diagonally opposing nodes of the element have the same sign of phi.
A narrow pair is ambiguous as to which intersection points should be connected together. This function is implemented such that it considers the “narrow channel” between the parallel boundary edges to be outside of the domain. In other words, at a narrow pair, the domain is considered to be disconnected instead of connected with a narrow channel.
A point on the edge of a boundary element where the boundary of the described domain (approximately) intersects the grid (i. e., phi has a zero). It can be characterised by a pair of inside/outside nodes at each end of the edge it intersects and by the fraction of the side that lies inside the domain.
The boundary of the described domain. I. e., the curve given by the zero level-set of phi. It may consist of several components, which are each a closed curve.
A single edge of the domain’s boundary, which is a line connecting two intersection points and cutting through a boundary element. It is ordered in such a way that the domain is on the left, if the grid is interpreted as coordinate system. (On the right in matrix ordering.)
The returned variable geom will be a struct with these fields:
dimThe dimension of the grid, equal to size (phi).
elemItself a struct describing the elements of the grid. It contains:
nNumber of elements on the grid. Equal to (l - 1) x (m - 1) if phi is l x m.
nodelistn x 4 matrix containing in its rows the indices of nodes
making up each element. According to the ordering in the matrix phi,
the nodes are stored in the order SE, SW, NW, NE. Interpreted in a
(x, y) grid constructed via meshgrid, the order is instead
NE, NW, SW, SE matching the usual numbering of quadrants in the plane.
(This is the case because the y axis points down when numbering rows
of a matrix, but up in the usual coordinate system.)
typeA vector giving the type of each element. It is -1, 0 and 1 for inner, boundary and outer elements, respectively. (This convention mimics the sign of phi somewhat.)
indexItself a struct with the fields inner, bdry
and outer, containing a list of indices for inner, boundary
and outer elements.
These equal the result of find (geom.elem.type == x)
with x being -1, 0 and 1.
bdryelA struct with information about the boundary elements. They have their
own index here, which can be mapped to the global element index
via geom.elem.index.bdry. Its fields are:
nNumber of boundary elements.
edgesn x 4 matrix, whose columns correspond to the four edges of
the boundary elements. For each edge where an intersection point lies,
the respective matrix entry is set to the intersection point’s index
into geom.ispts.
If there is no intersection point, the value is NA.
The edges are ordered similarly to the order in
geom.elem.nodelist. In matrix interpretation, the
edges are in the columns as S, W, N, E. Interpreted as a coordinate
grid, the order is N, W, S, E.
isptsStruct containing details about the intersection points with the fields:
nNumber of intersection points.
inoutn x 2 matrix containing the node indices of the inner and
outer nodes neighbouring each intersection point (in this order).
fracFraction of the edge that is inside the domain (connecting the intersection point to the inner neighbour node). This value is always in the range 0–1, independent of h.
incoordCoordinates of the intersection points relative to the neighbouring
inner nodes as a n x 2 matrix. This takes h into account.
onedgen x 2 x 3 array that indicates on which edges of which
boundary elements this intersection point occurs. The first dimension
is indexed by intersection point number, the second dimension numbers
the (two) boundary elements each intersection point is part of, and
the third dimension contains the tuple (boundary element index, edge index,
boundary edge index) in the ranges 1–geom.bdryel.n, 1–4
and 1–geom.bedges.n.
The occurances (second dimension) are ordered such that the first one is where the boundary edge “enters” the boundary element, while the second one is where it “leaves” a boundary element.
gammachainn x 2 matrix that contains for each intersection point
the next and previous intersection point indices when
following gamma. See also geom.gamma.ispts.
gammaStruct with information about the components of the domain’s boundary. It contains these fields:
nNumber of gamma components.
isptsCell-array with n elements. Each element is a list of indices
of intersection points (i. e., indices into geom.ispts).
In the order given, they can be joined together to form a closed curve
(when also the last one is connected back to the first).
bedgesInformation about the boundary edges:
nNumber of boundary edges in total.
compA vector giving the gamma component this edge is part of. The
components are in the range 1–geom.gamma.n.
isptsn x 2 matrix containing the intersection point indices that
make up each boundary edge.
internalData field with additional information for internal use, in particular
in ls_build_mesh. The precise format may be subject to change
and should not be used.
See also: ls_absolute_geom, ls_normalise, ls_build_mesh, ls_inside.
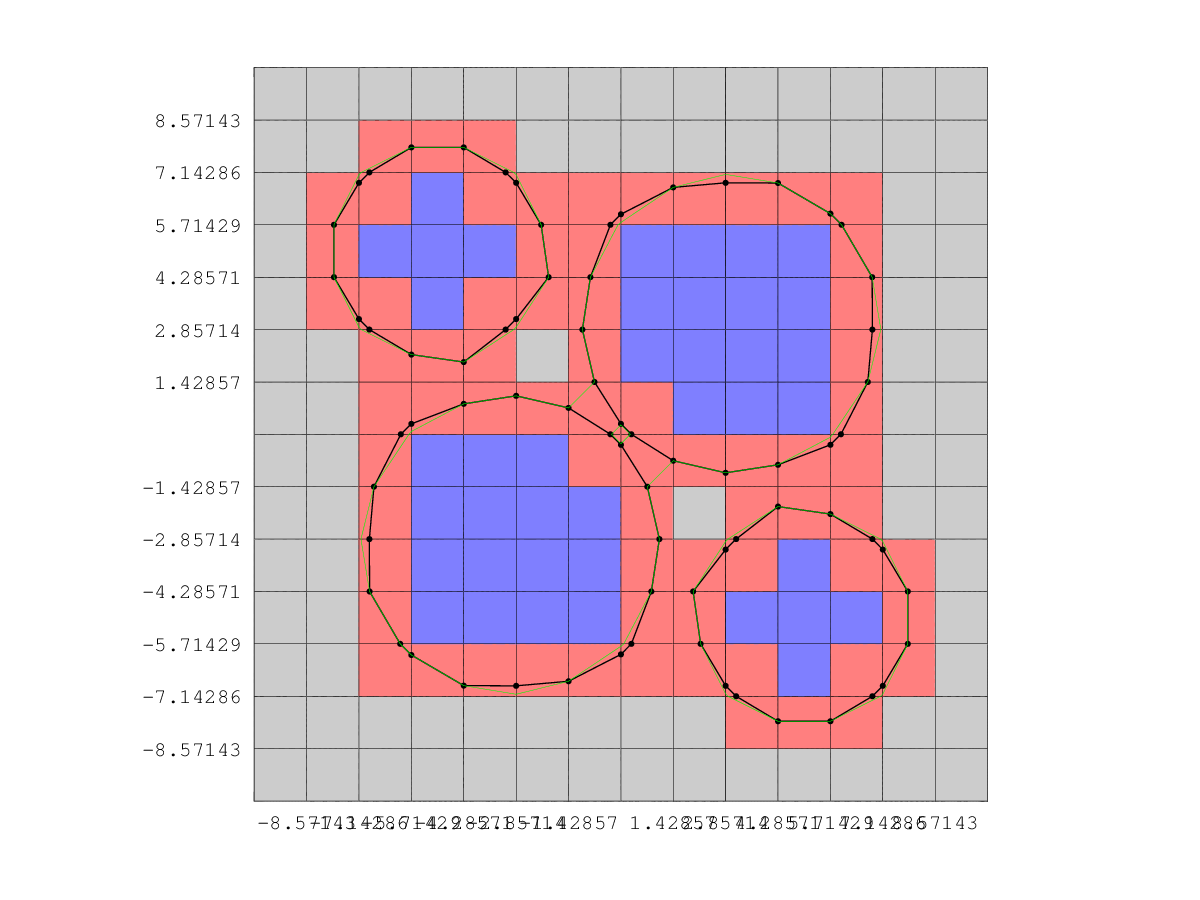
The following code
  n = 15;
  x = linspace (-10, 10, n);
  h = x(2) - x(1);
  [XX, YY] = meshgrid (x, x);

  r1 = sqrt (2) * 2.9;
  r2 = 3;
  phi = ls_union (ls_genbasic (XX, YY, "sphere", [-3, -3], r1), ...
                  ls_genbasic (XX, YY, "sphere", [3, 3], r1), ...
                  ls_genbasic (XX, YY, "sphere", [-5, 5], r2), ...
                  ls_genbasic (XX, YY, "sphere", [5, -5], r2));

  phi = ls_normalise (phi, h);
  g = ls_find_geometry (phi, h, 0.2);
  g = ls_absolute_geom (g, XX, YY);

  figure ();
  hold ("on");

  for i = 1 : size (g.elem.nodelist, 1)
    nodes = g.elem.nodelist(i, :);
    switch (g.elem.type(i))
      case -1
        colour = [0.5, 0.5, 1];
      case 0
        colour = [1, 0.5, 0.5];
      case 1
        colour = [0.8, 0.8, 0.8];
    endswitch
    patch (XX(nodes), YY(nodes), colour);
  endfor

  plot (g.ispts.coord(:, 1), g.ispts.coord(:, 2), "k.", "MarkerSize", 8);
  for i = 1 : g.gamma.n
    pts = g.gamma.ispts{i};
    pts(end + 1) = pts(1);
    plot (g.ispts.coord(pts, 1), g.ispts.coord(pts, 2), "k-", "LineWidth", 2);
  endfor

  contour (XX, YY, phi, [0, 0], "g");

  axis ([min(x), max(x), min(x), max(x)]);
  axis ("equal");
  grid ("on");
  set (gca (), "xtick", x, "ytick", x, "xticklabel", "", "yticklabel", "");
  hold ("off");
Produces the following figure
| Figure 1 |
|---|
 |
Package: level-set