
|
Octave-Forge - Extra packages for GNU Octave |
| Home · Packages · Developers · Documentation · FAQ · Bugs · Mailing Lists · Links · Code |
|
|
Octave-Forge - Extra packages for GNU Octave |
| Home · Packages · Developers · Documentation · FAQ · Bugs · Mailing Lists · Links · Code |
"sign")"sign")Construct a colour map that can visibly distinguish between positive and negative values. These colour maps are especially suited to show the distinction between above-zero and below-zero of a level-set function or for speed fields between moving outward and inward.
The colour axis range for which it is used should be given in ax. There will always be 1024 entries in the constructed colour map.
The map is “defined” by four colours, with a colour gradient between the first two for positive values and a gradient between the third and fourth for negative values. These colours can be explicitly given in colours as a 4 x 3 matrix. Predefined “types” of maps can be loaded with a string as type argument. It can be:
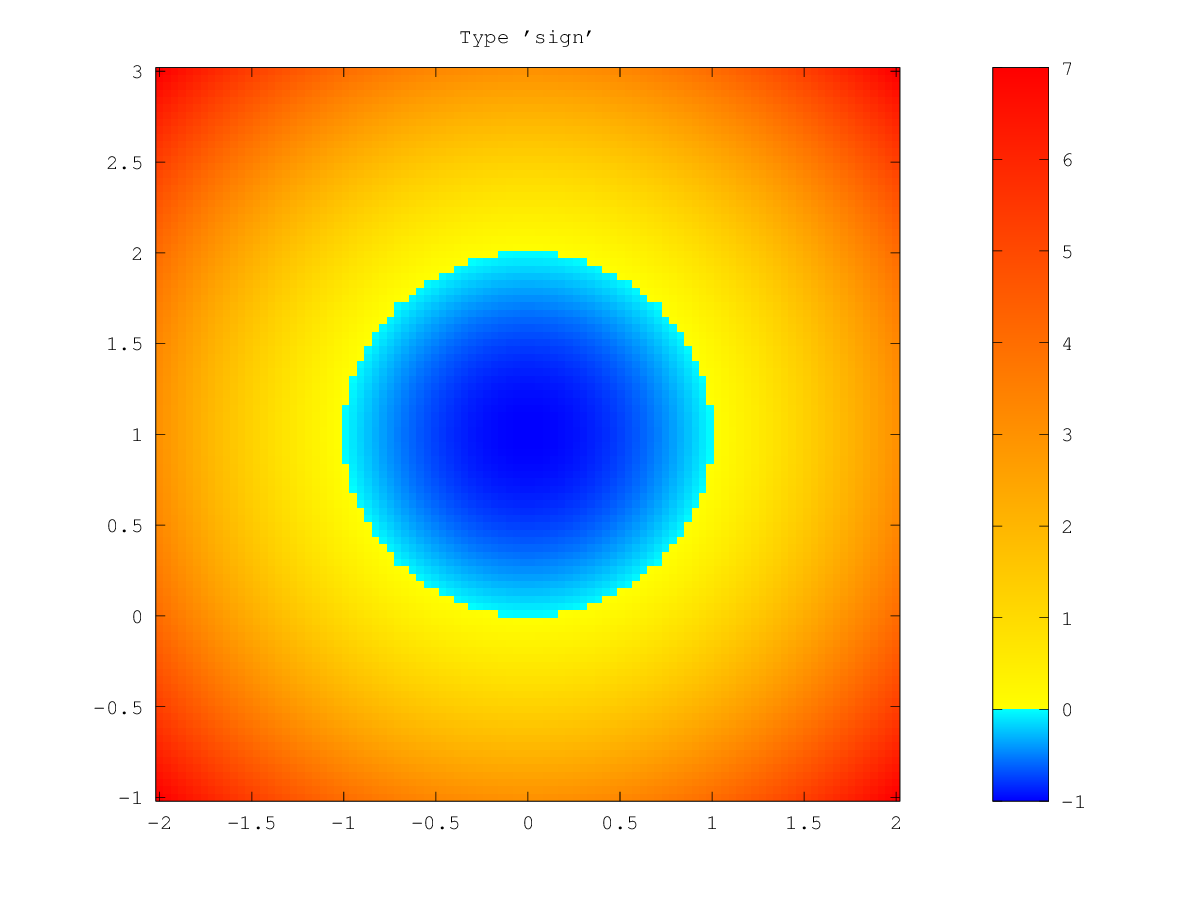
"sign"The default value. Values above zero will be yellow–red, and values below zero cyan–blue. There is a visible discontinuity in colour at the zero level-set, with yellow and cyan on both “sides” of the transition.
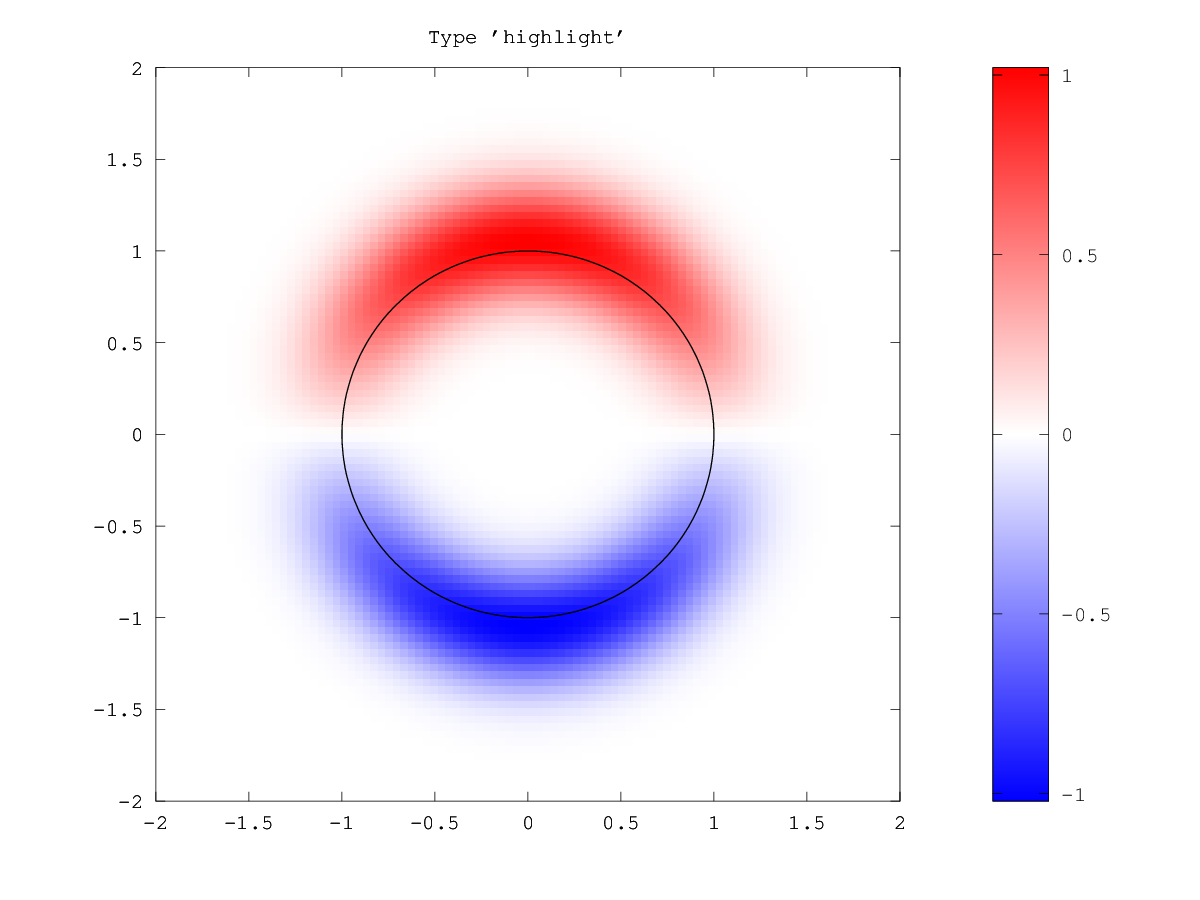
"highlight"Show zero as white (independent of the sign). Positive and negative values are marked as red and blue, respectively. This is useful to show speed fields and just highlight where they are most active. (Like a heat map.)
The forms without ax and output arguments use caxis () of the
current figure and set the figure’s colour map to the result, instead of
returning the constructed colour map.
Use demo ls_sign_colourmap to get an overview of how the
predefined maps look like.
See also: colormap, colorbar.
The following code
  n = 100;
  x = linspace (-2, 2, n);
  y = linspace (-1, 3, n);
  [XX, YY] = meshgrid (x, y);
  phi = ls_genbasic (XX, YY, "sphere", [0, 1], 1);

  figure ();
  imagesc (x, y, phi);
  set (gca (), "ydir", "normal");
  ls_sign_colourmap ();
  colorbar ();
  title ("Type 'sign'");
Produces the following figure
| Figure 1 |
|---|
 |
The following code
  n = 100;
  x = linspace (-2, 2, n);
  h = x(2) - x(1);
  [XX, YY] = meshgrid (x, x);

  phi = ls_genbasic (XX, YY, "sphere", [0, 0], 1);
  d = ls_signed_distance (phi, h);
  F = YY .* exp (-10 * d.^2);

  figure ();
  hold ("on");
  imagesc (x, x, F);
  set (gca (), "ydir", "normal");
  ls_sign_colourmap ("highlight");
  colorbar ();
  contour (XX, YY, phi, [0, 0], "k", "LineWidth", 2);
  hold ("off");
  title ("Type 'highlight'");
Produces the following figure
| Figure 1 |
|---|
 |
Package: level-set