
|
Octave-Forge - Extra packages for GNU Octave |
| Home · Packages · Developers · Documentation · FAQ · Bugs · Mailing Lists · Links · Code |
|
|
Octave-Forge - Extra packages for GNU Octave |
| Home · Packages · Developers · Documentation · FAQ · Bugs · Mailing Lists · Links · Code |
Set axis limits and appearance.
The argument limits should be a 2-, 4-, or 6-element vector. The first and second elements specify the lower and upper limits for the x-axis. The third and fourth specify the limits for the y-axis, and the fifth and sixth specify the limits for the z-axis. The special values -Inf and Inf may be used to indicate that the limit should automatically be computed based on the data in the axis.
Without any arguments, axis turns autoscaling on.
With one output argument, limits = axis returns the current
axis limits.
The vector argument specifying limits is optional, and additional string arguments may be used to specify various axis properties. For example,
axis ([1, 2, 3, 4], "square");
forces a square aspect ratio, and
axis ("tic", "labely");
turns tic marks on for all axes and tic mark labels on for the y-axis only.
The following options control the aspect ratio of the axes.
"square"Force a square aspect ratio.
"equal"Force x distance to equal y-distance.
"normal"Restore default aspect ratio.
The following options control the way axis limits are interpreted.
"auto"Set the specified axes to have nice limits around the data or all if no axes are specified.
"manual"Fix the current axes limits.
"tight"Fix axes to the limits of the data.
"image"Equivalent to "tight" and "equal".
The following options affect the appearance of tic marks.
"on"Turn tic marks and labels on for all axes.
"off"Turn tic marks off for all axes.
"tic[xyz]"Turn tic marks on for all axes, or turn them on for the specified axes and off for the remainder.
"label[xyz]"Turn tic labels on for all axes, or turn them on for the specified axes and off for the remainder.
"nolabel"Turn tic labels off for all axes.
Note, if there are no tic marks for an axis, there can be no labels.
The following options affect the direction of increasing values on the axes.
"ij"Reverse y-axis, so lower values are nearer the top.
"xy"Restore y-axis, so higher values are nearer the top.
If the first argument hax is an axes handle, then operate on this
axes rather than the current axes returned by gca.
See also: xlim, ylim, zlim, daspect, pbaspect, box, grid.
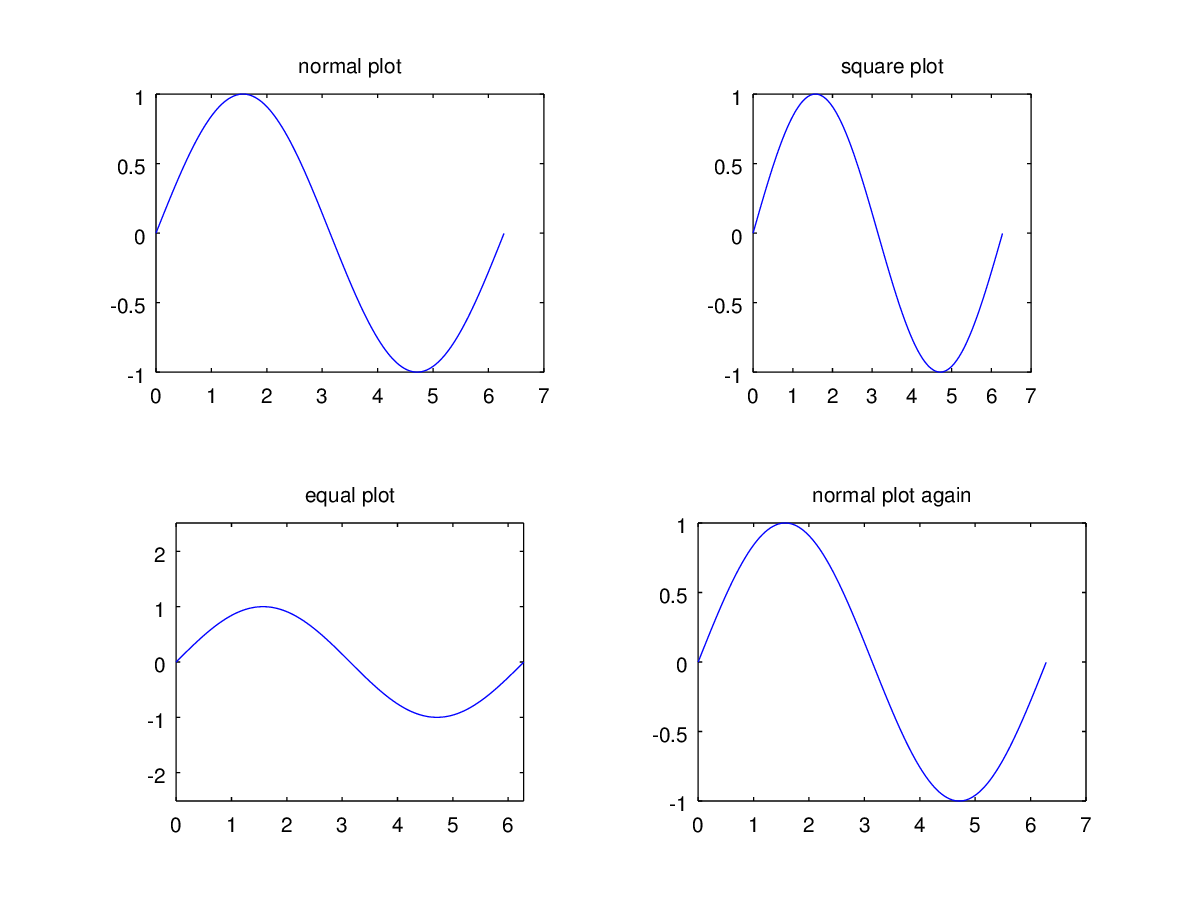
The following code
 clf;
 t = 0:0.01:2*pi;
 x = sin (t);

 subplot (221);
  plot (t, x);
  title ('normal plot');

 subplot (222);
  plot (t, x);
  title ('square plot');
  axis ('square');

 subplot (223);
  plot (t, x);
  title ('equal plot');
  axis ('equal');

 subplot (224);
  plot (t, x);
  title ('normal plot again');
  axis ('normal');
Produces the following figure
| Figure 1 |
|---|
 |
The following code
 clf;
 t = 0:0.01:2*pi;
 x = sin (t);

 subplot (121);
  plot (t, x);
  title ('ij plot');
  axis ('ij');

 subplot (122);
  plot (t, x);
  title ('xy plot');
  axis ('xy');
Produces the following figure
| Figure 1 |
|---|
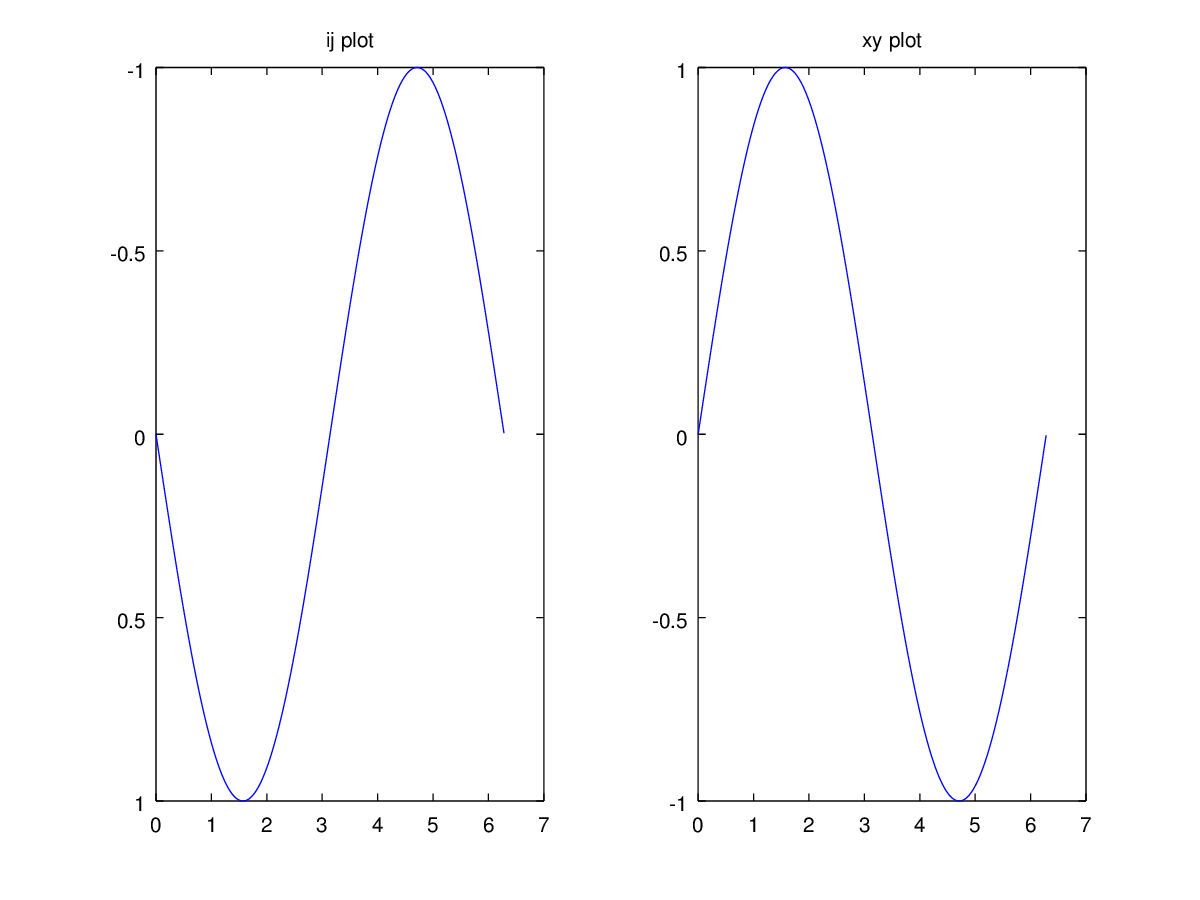 |
The following code
 clf;
 t = 0:0.01:2*pi;
 x = sin (t);

 subplot (331);
  plot (t, x);
  title ('x tics and labels');
  axis ('ticx');

 subplot (332);
  plot (t, x);
  title ('y tics and labels');
  axis ('ticy');

 subplot (333);
  plot (t, x);
  title ('axis off');
  axis ('off');

 subplot (334);
  plot (t, x);
  title ('x and y tics, x labels');
  axis ('labelx','tic');

 subplot (335);
  plot (t, x);
  title ('x and y tics, y labels');
  axis ('labely','tic');

 subplot (336);
  plot (t, x);
  title ('all tics but no labels');
  axis ('nolabel','tic');

 subplot (337);
  plot (t, x);
  title ('x tics, no labels');
  axis ('nolabel','ticx');

 subplot (338);
  plot (t, x);
  title ('y tics, no labels');
  axis ('nolabel','ticy');

 subplot (339);
  plot (t, x);
  title ('all tics and labels');
  axis ('on');
Produces the following figure
| Figure 1 |
|---|
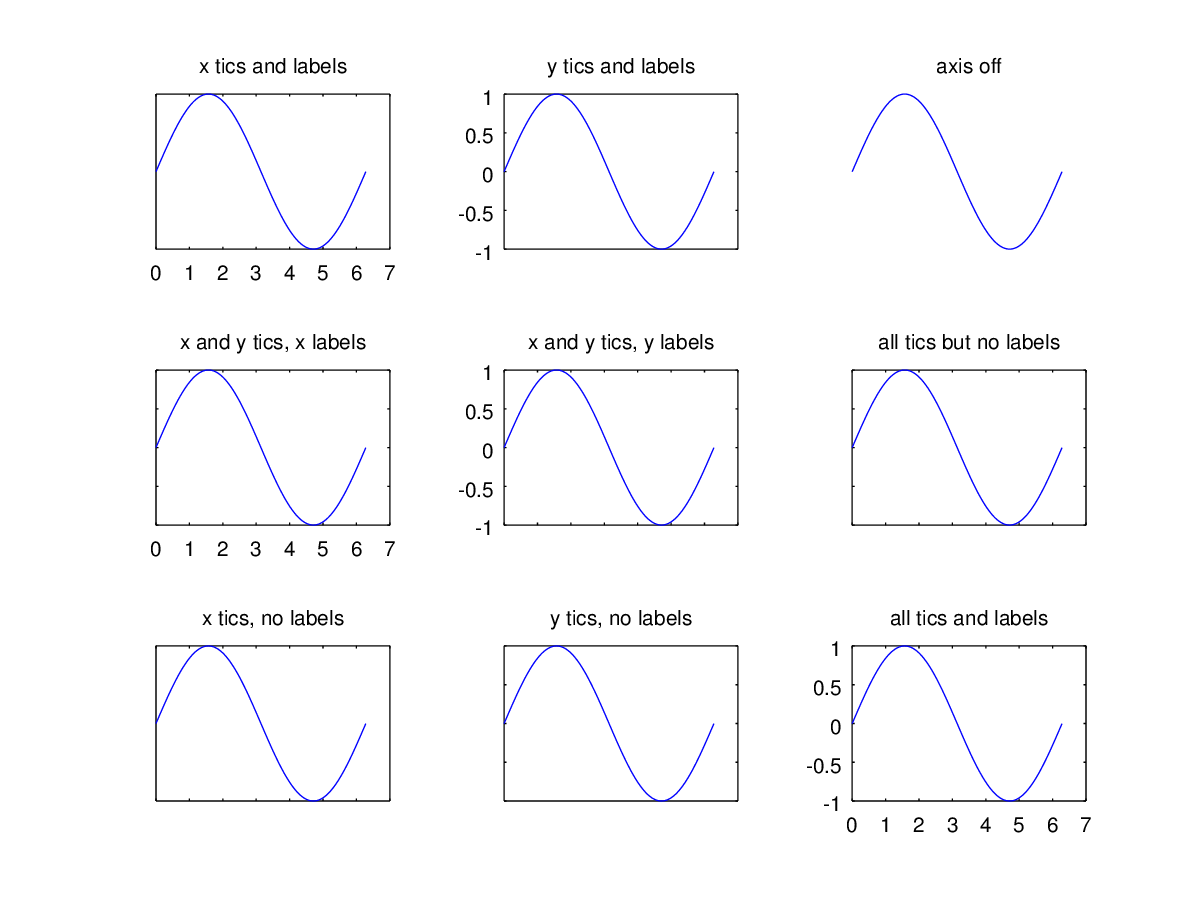 |
The following code
 clf;
 t = 0:0.01:2*pi;
 x = sin (t);

 subplot (321);
  plot (t, x);
  title ('axes at [0 3 0 1]');
  axis ([0,3,0,1]);

 subplot (322);
  plot (t, x);
  title ('auto');
  axis ('auto');

 subplot (323);
  plot (t, x, ';sine [0:2pi];'); hold on;
  plot (-3:3,-3:3, ';line (-3,-3)->(3,3);'); hold off;
  title ('manual');
  axis ('manual');

 subplot (324);
  plot (t, x, ';sine [0:2pi];');
  title ('axes at [0 3 0 1], then autox');
  axis ([0,3,0,1]);
  axis ('autox');

 subplot (325);
  plot (t, x, ';sine [0:2pi];');
  title ('axes at [3 6 0 1], then autoy');
  axis ([3,6,0,1]);
  axis ('autoy');

 subplot (326);
  plot (t, sin(t), t, -2*sin(t/2));
  axis ('tight');
  title ('tight');
Produces the following figure
| Figure 1 |
|---|
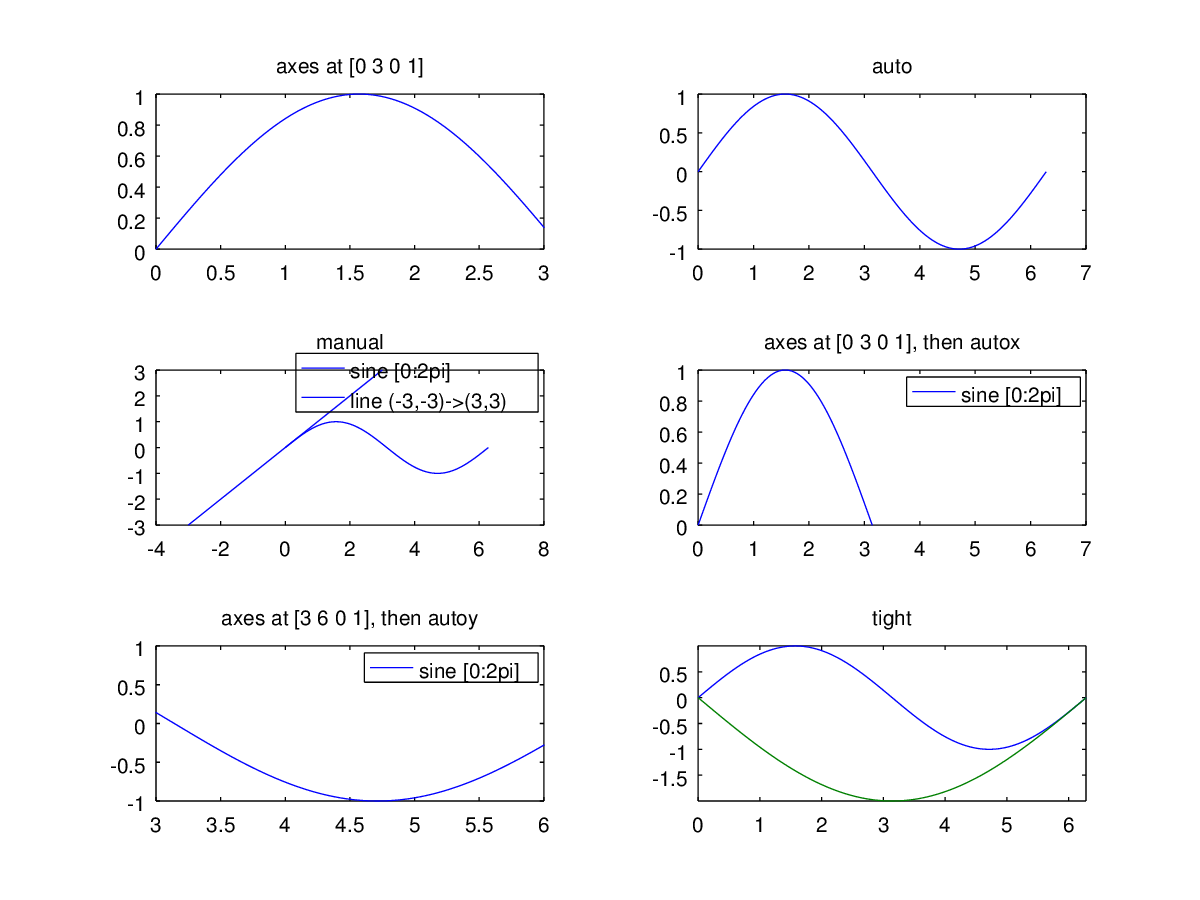 |
The following code
 clf;
 x = 0:0.1:10;
 plot (x, sin(x));
 axis image;
 title ({'image', 'equivalent to "tight" & "equal"'});
Produces the following figure
| Figure 1 |
|---|
 |
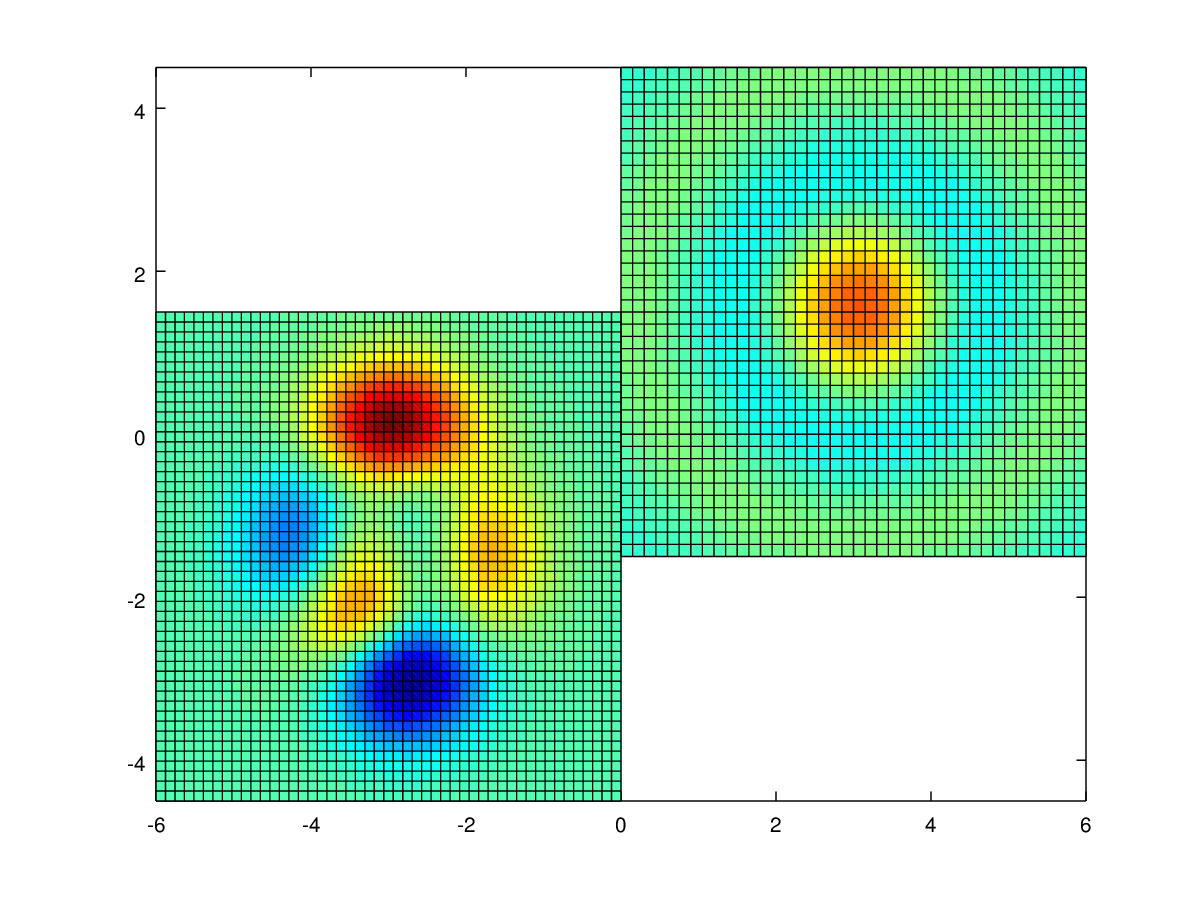
The following code
 clf;
 colormap ('default');
 [x,y,z] = peaks (50);
 x1 = max (x(:));
 pcolor (x-x1, y-x1/2, z);
 hold on;
 [x,y,z] = sombrero ();
 s = x1 / max (x(:));
 pcolor (s*x+x1, s*y+x1/2, 5*z);
 axis tight;
Produces the following figure
| Figure 1 |
|---|
 |
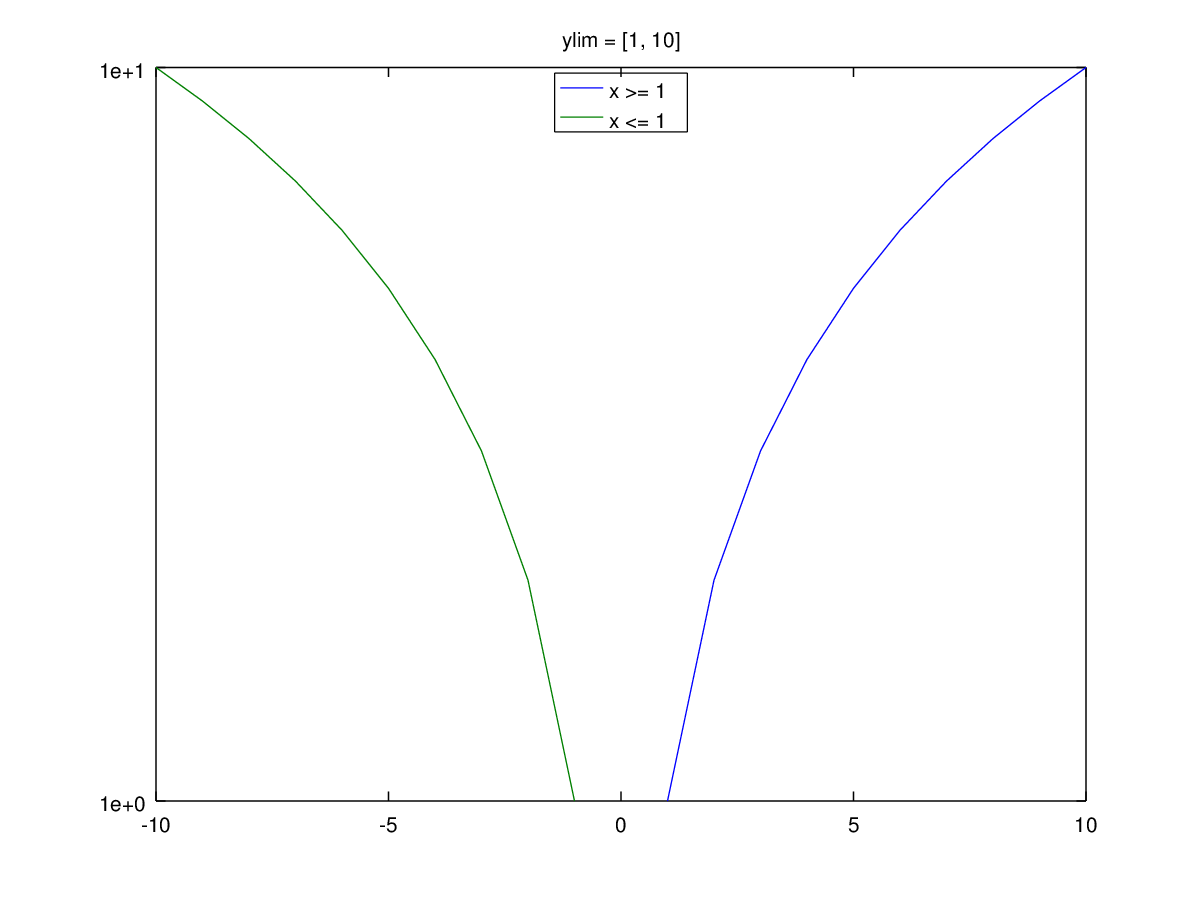
The following code
 clf;
 x = -10:10;
 plot (x,x, x,-x);
 set (gca, 'yscale', 'log');
 legend ({'x >= 1', 'x <= 1'}, 'location', 'north');
 title ('ylim = [1, 10]');
Produces the following output
warning: axis: omitting non-positive data in log plot
and the following figure
| Figure 1 |
|---|
 |
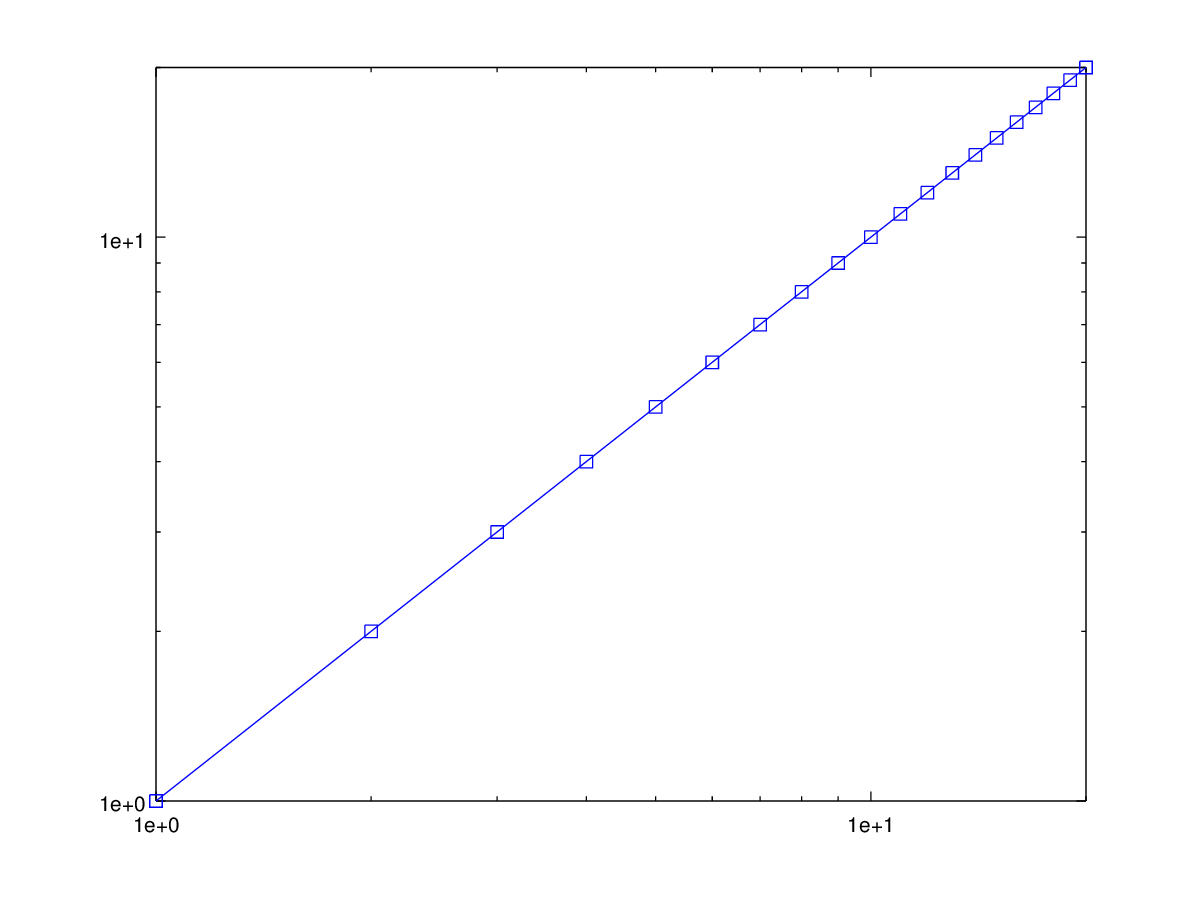
The following code
 clf;
 loglog (1:20, '-s');
 axis tight;
Produces the following figure
warning: axis: omitting non-positive data in log plot
and the following figure
| Figure 1 |
|---|
 |
The following code
 clf;
 x = -10:0.1:10;
 y = sin (x)./(1 + abs (x)) + 0.1*x - 0.4;
 plot (x, y);
 set (gca, 'xaxislocation', 'zero');
 set (gca, 'yaxislocation', 'zero');
 box off;
 title ({'no plot box', 'xaxislocation = zero, yaxislocation = zero'});
Produces the following figure
warning: axis: omitting non-positive data in log plot
and the following figure
| Figure 1 |
|---|
 |
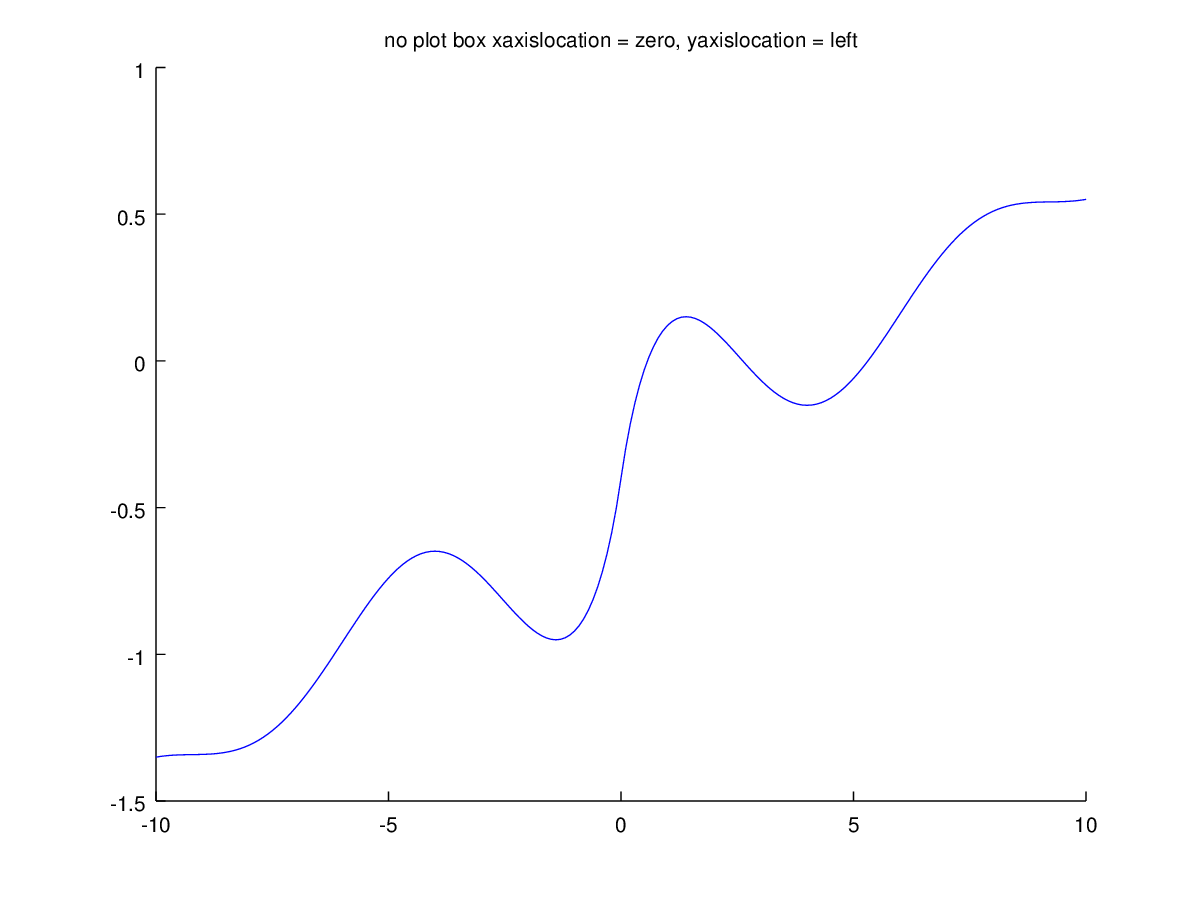
The following code
 clf;
 x = -10:0.1:10;
 y = sin (x)./(1+abs (x)) + 0.1*x - 0.4;
 plot (x, y);
 set (gca, 'xaxislocation', 'zero');
 set (gca, 'yaxislocation', 'left');
 box off;
 title ({'no plot box', 'xaxislocation = zero, yaxislocation = left'});
Produces the following figure
warning: axis: omitting non-positive data in log plot
and the following figure
| Figure 1 |
|---|
 |
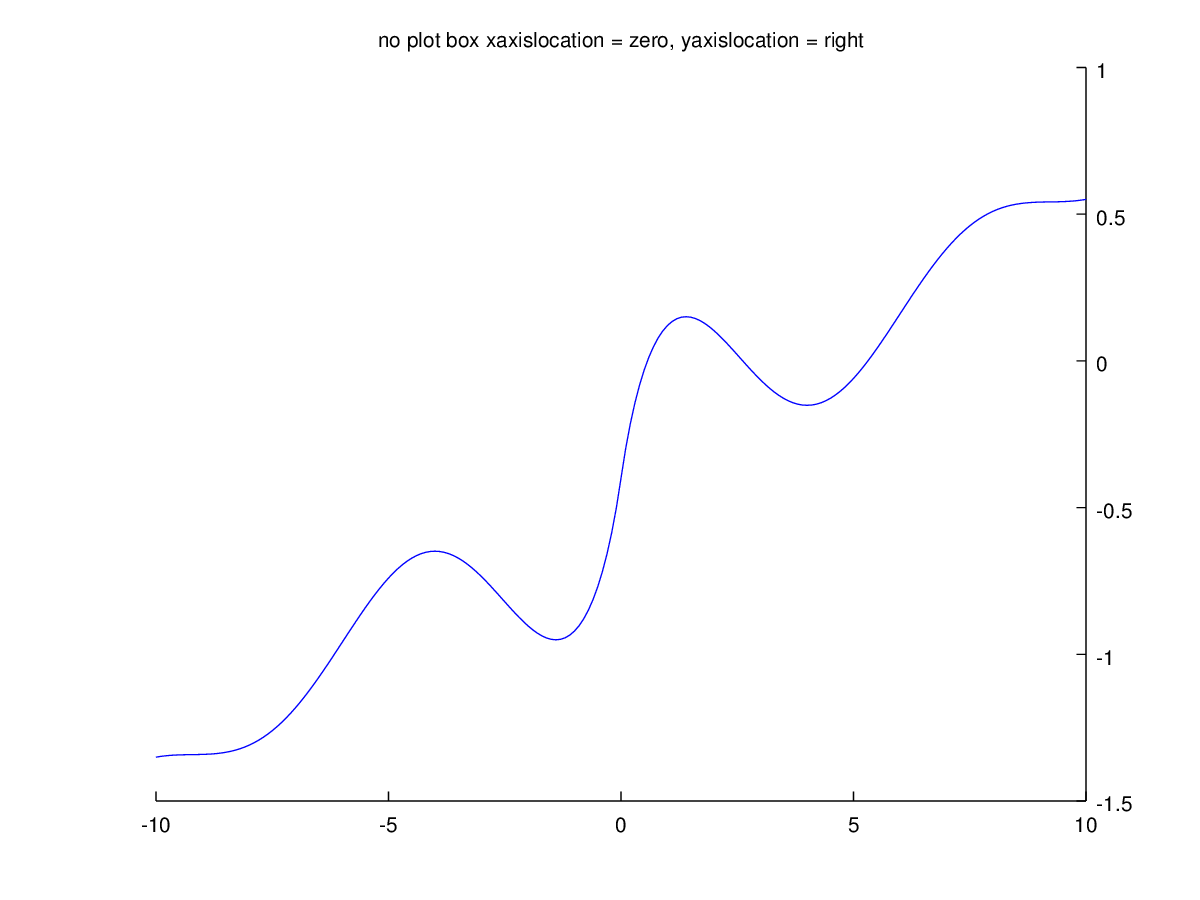
The following code
 clf;
 x = -10:0.1:10;
 y = sin (x)./(1+abs (x)) + 0.1*x - 0.4;
 plot (x, y);
 title ('no plot box');
 set (gca, 'xaxislocation', 'zero');
 set (gca, 'yaxislocation', 'right');
 box off;
 title ({'no plot box', 'xaxislocation = zero, yaxislocation = right'});
Produces the following figure
warning: axis: omitting non-positive data in log plot
and the following figure
| Figure 1 |
|---|
 |
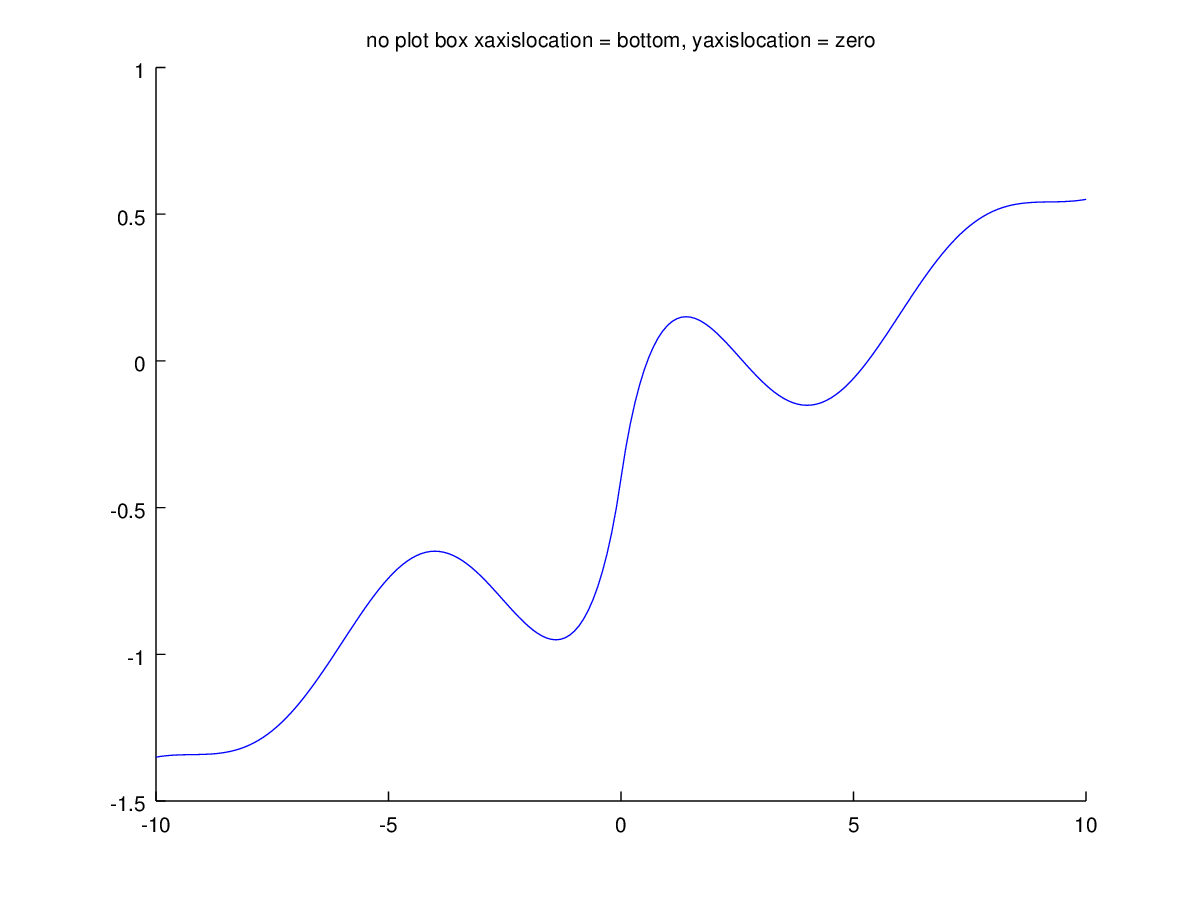
The following code
 clf;
 x = -10:0.1:10;
 y = sin (x)./(1+abs (x)) + 0.1*x - 0.4;
 plot (x, y);
 set (gca, 'xaxislocation', 'bottom');
 set (gca, 'yaxislocation', 'zero');
 box off;
 title ({'no plot box', 'xaxislocation = bottom, yaxislocation = zero'});
Produces the following figure
warning: axis: omitting non-positive data in log plot
and the following figure
| Figure 1 |
|---|
 |
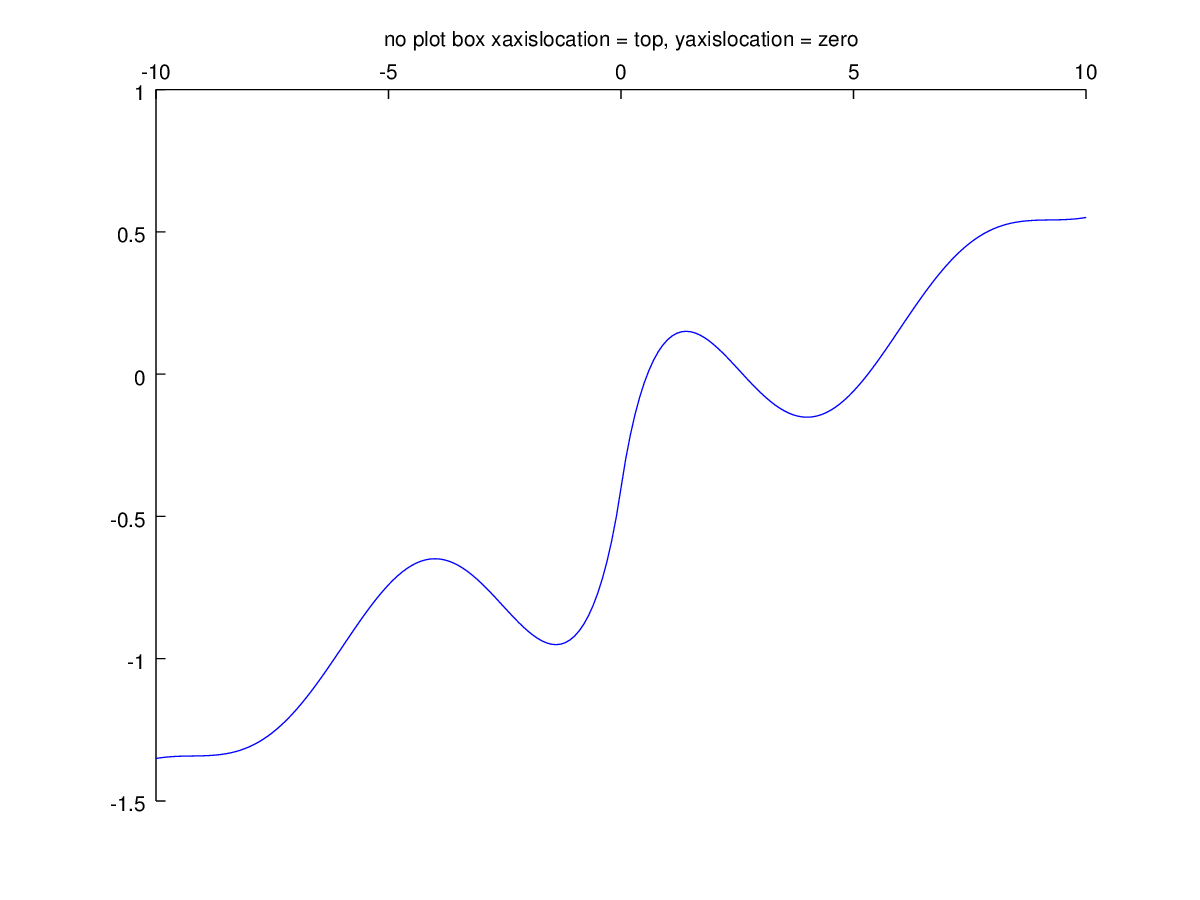
The following code
 clf;
 x = -10:0.1:10;
 y = sin (x)./(1+abs (x)) + 0.1*x - 0.4;
 plot (x, y);
 set (gca, 'xaxislocation', 'top');
 set (gca, 'yaxislocation', 'zero');
 box off;
 title ({'no plot box', 'xaxislocation = top, yaxislocation = zero'});
Produces the following figure
warning: axis: omitting non-positive data in log plot
and the following figure
| Figure 1 |
|---|
 |
Package: octave