
|
Octave-Forge - Extra packages for GNU Octave |
| Home · Packages · Developers · Documentation · FAQ · Bugs · Mailing Lists · Links · Code |
|
|
Octave-Forge - Extra packages for GNU Octave |
| Home · Packages · Developers · Documentation · FAQ · Bugs · Mailing Lists · Links · Code |
Produce a bar graph from two vectors of X-Y data.
If only one argument is given, y, it is taken as a vector of Y values
and the X coordinates are the range 1:numel (y).
The optional input w controls the width of the bars. A value of 1.0 will cause each bar to exactly touch any adjacent bars. The default width is 0.8.
If y is a matrix, then each column of y is taken to be a separate bar graph plotted on the same graph. By default the columns are plotted side-by-side. This behavior can be changed by the style argument which can take the following values:
"grouped" (default)Side-by-side bars with a gap between bars and centered over the X-coordinate.
"stacked"Bars are stacked so that each X value has a single bar composed of multiple segments.
"hist"Side-by-side bars with no gap between bars and centered over the X-coordinate.
"histc"Side-by-side bars with no gap between bars and left-aligned to the X-coordinate.
Optional property/value pairs are passed directly to the underlying patch objects.
If the first argument hax is an axes handle, then plot into this axis,
rather than the current axes returned by gca.
The optional return value h is a vector of handles to the created "bar series" hggroups with one handle per column of the variable y. This series makes it possible to change a common element in one bar series object and have the change reflected in the other "bar series". For example,
h = bar (rand (5, 10));
set (h(1), "basevalue", 0.5);
changes the position on the base of all of the bar series.
The following example modifies the face and edge colors using property/value pairs.
bar (randn (1, 100), "facecolor", "r", "edgecolor", "b");
The color of the bars is taken from the figure’s colormap, such that
bar (rand (10, 3));
colormap (summer (64));
will change the colors used for the bars. The color of bars can also be set
manually using the "facecolor" property as shown below.
h = bar (rand (10, 3));
set (h(1), "facecolor", "r")
set (h(2), "facecolor", "g")
set (h(3), "facecolor", "b")
See also: barh, hist, pie, plot, patch.
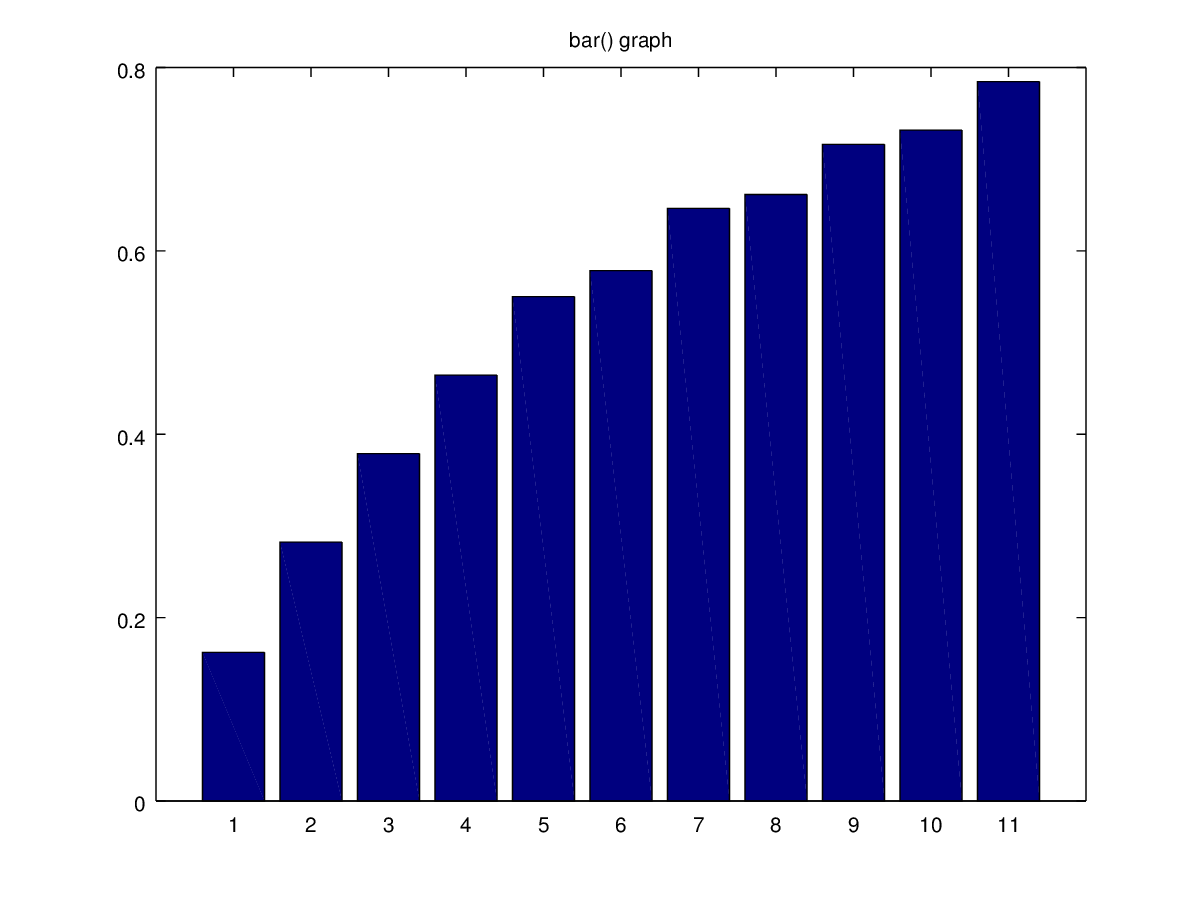
The following code
 clf;
 y = rand (11, 1);
 h = bar (y);
 set (h, 'ydata', sort (rand (11, 1)));
 title ('bar() graph');
Produces the following figure
| Figure 1 |
|---|
 |
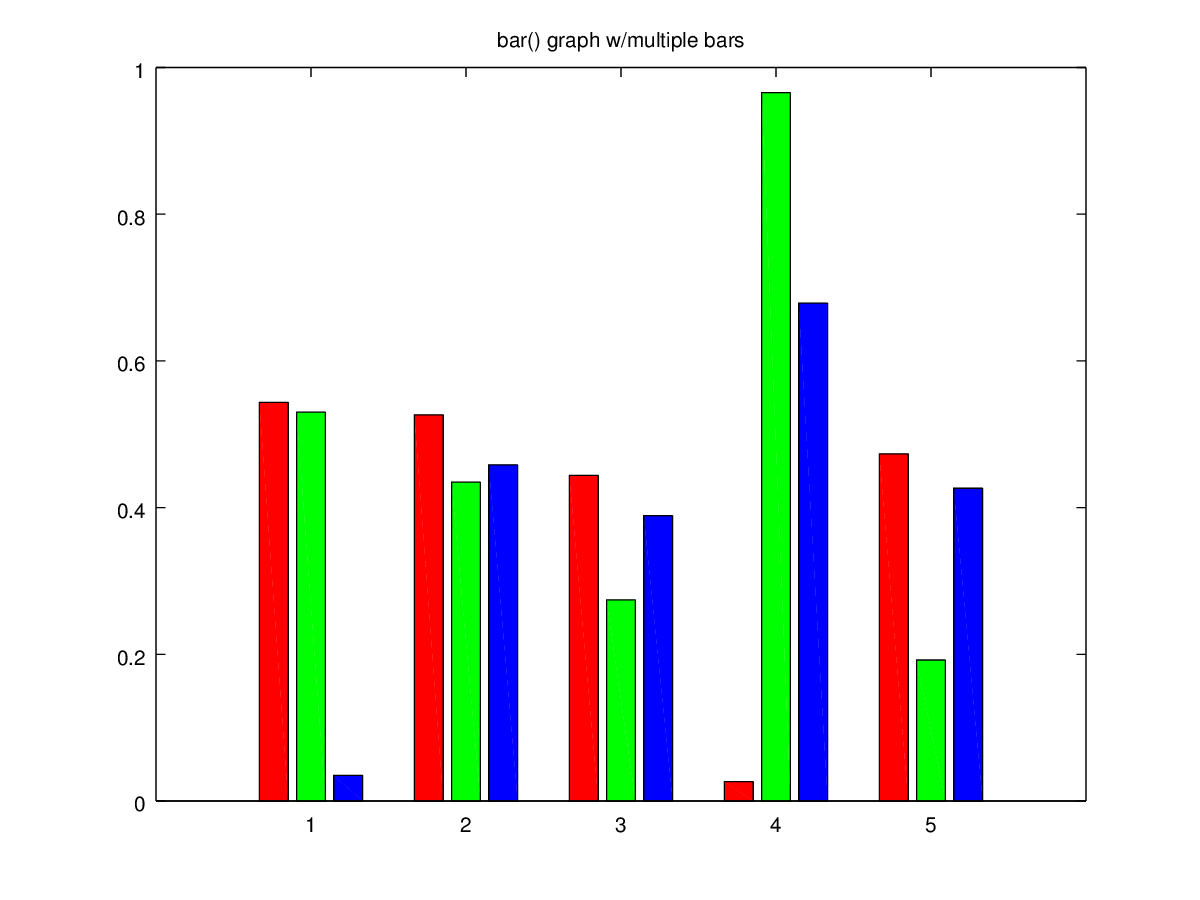
The following code
 clf;
 h = bar (rand (5, 3));
 set (h(1), 'facecolor', 'r');
 set (h(2), 'facecolor', 'g');
 set (h(3), 'facecolor', 'b');
 title ('bar() graph w/multiple bars');
Produces the following figure
| Figure 1 |
|---|
 |
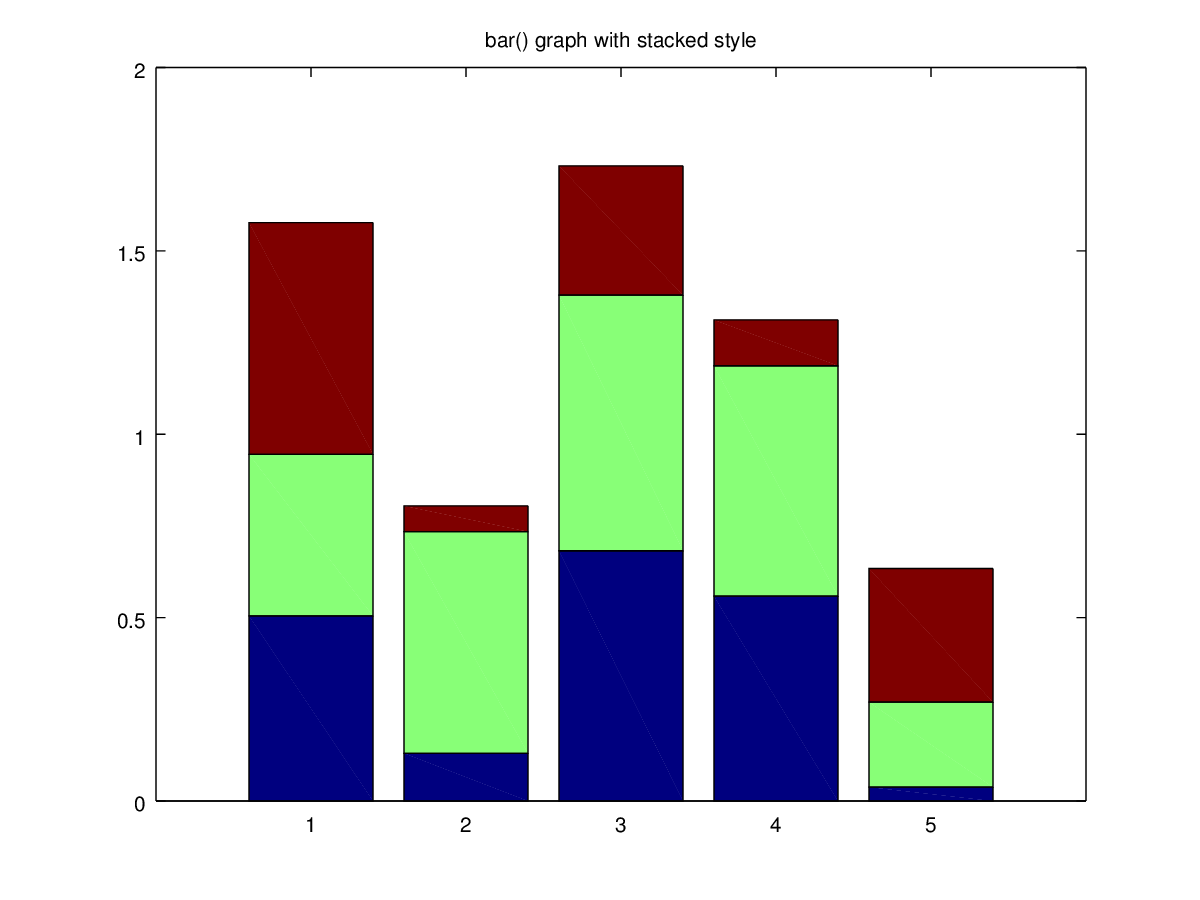
The following code
 clf;
 h = bar (rand (5, 3), 'stacked');
 title ('bar() graph with stacked style');
Produces the following figure
| Figure 1 |
|---|
 |
Package: octave