
|
Octave-Forge - Extra packages for GNU Octave |
| Home · Packages · Developers · Documentation · FAQ · Bugs · Mailing Lists · Links · Code |
|
|
Octave-Forge - Extra packages for GNU Octave |
| Home · Packages · Developers · Documentation · FAQ · Bugs · Mailing Lists · Links · Code |
Add date formatted tick labels to an axis.
The axis to apply the ticks to is determined by axis which can take
the values "x", "y", or "z". The default value is
"x".
The formatting of the labels is determined by the variable form, which
can either be a string or positive integer that datestr accepts.
See also: datenum, datestr.
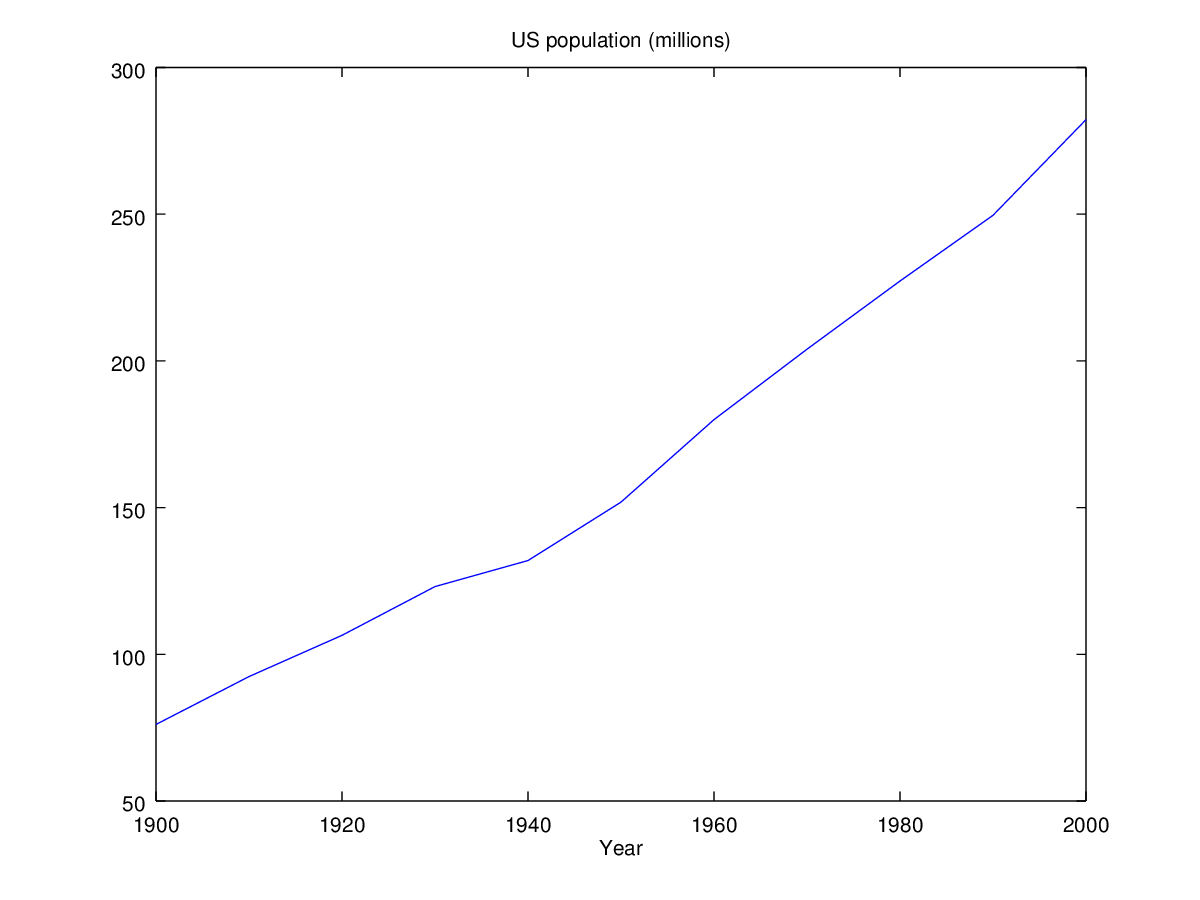
The following code
 clf;
 yr = 1900:10:2000;
 pop = [76.094, 92.407, 106.461, 123.077 131.954, 151.868, 179.979, ...
        203.984, 227.225, 249.623, 282.224];
 plot (datenum (yr, 1, 1), pop);
 title ('US population (millions)');
 xlabel ('Year');
 datetick ('x', 'YYYY');
Produces the following figure
| Figure 1 |
|---|
 |
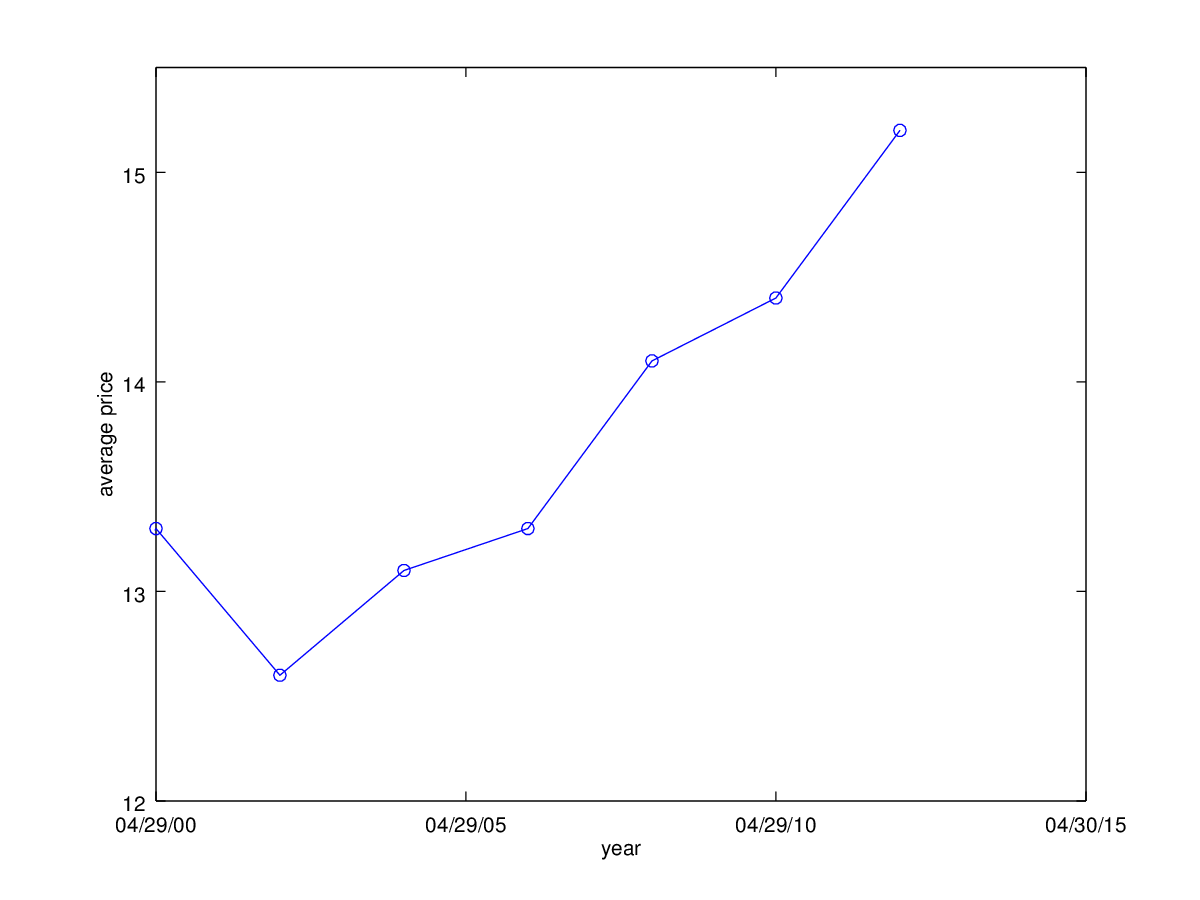
The following code
 clf;
 yr = 1988:2:2002;
 yr = datenum (yr,1,1);
 pr = [12.1 13.3 12.6 13.1 13.3 14.1 14.4 15.2];
 plot (yr, pr, '-o');
 xlabel ('year');
 ylabel ('average price');
 ax = gca;
 set (ax, 'xtick', datenum (1990:5:2005,1,1));
 datetick (2, 'x', 'keepticks');
 set (ax, 'ytick', 12:16);
Produces the following figure
| Figure 1 |
|---|
 |
Package: octave