
|
Octave-Forge - Extra packages for GNU Octave |
| Home · Packages · Developers · Documentation · FAQ · Bugs · Mailing Lists · Links · Code |
|
|
Octave-Forge - Extra packages for GNU Octave |
| Home · Packages · Developers · Documentation · FAQ · Bugs · Mailing Lists · Links · Code |
Display the image im, where im can be a 2-dimensional (grayscale image) or a 3-dimensional (RGB image) matrix.
If limits is a 2-element vector [low, high], the
image is shown using a display range between low and high. If
an empty matrix is passed for limits, the display range is computed
as the range between the minimal and the maximal value in the image.
If map is a valid color map, the image will be shown as an indexed image using the supplied color map.
If a file name is given instead of an image, the file will be read and shown.
If given, the parameter string_param1 has value value1. string_param1 can be any of the following:
"displayrange"value1 is the display range as described above.
"colormap"value1 is the colormap to use when displaying an indexed image.
"xdata"If value1 is a two element vector, it must contain horizontal axis limits in the form [xmin xmax]; Otherwise value1 must be a vector and only the first and last elements will be used for xmin and xmax respectively.
"ydata"If value1 is a two element vector, it must contain vertical axis limits in the form [ymin ymax]; Otherwise value1 must be a vector and only the first and last elements will be used for ymin and ymax respectively.
The optional return value h is a graphics handle to the image.
See also: image, imagesc, colormap, gray2ind, rgb2ind.
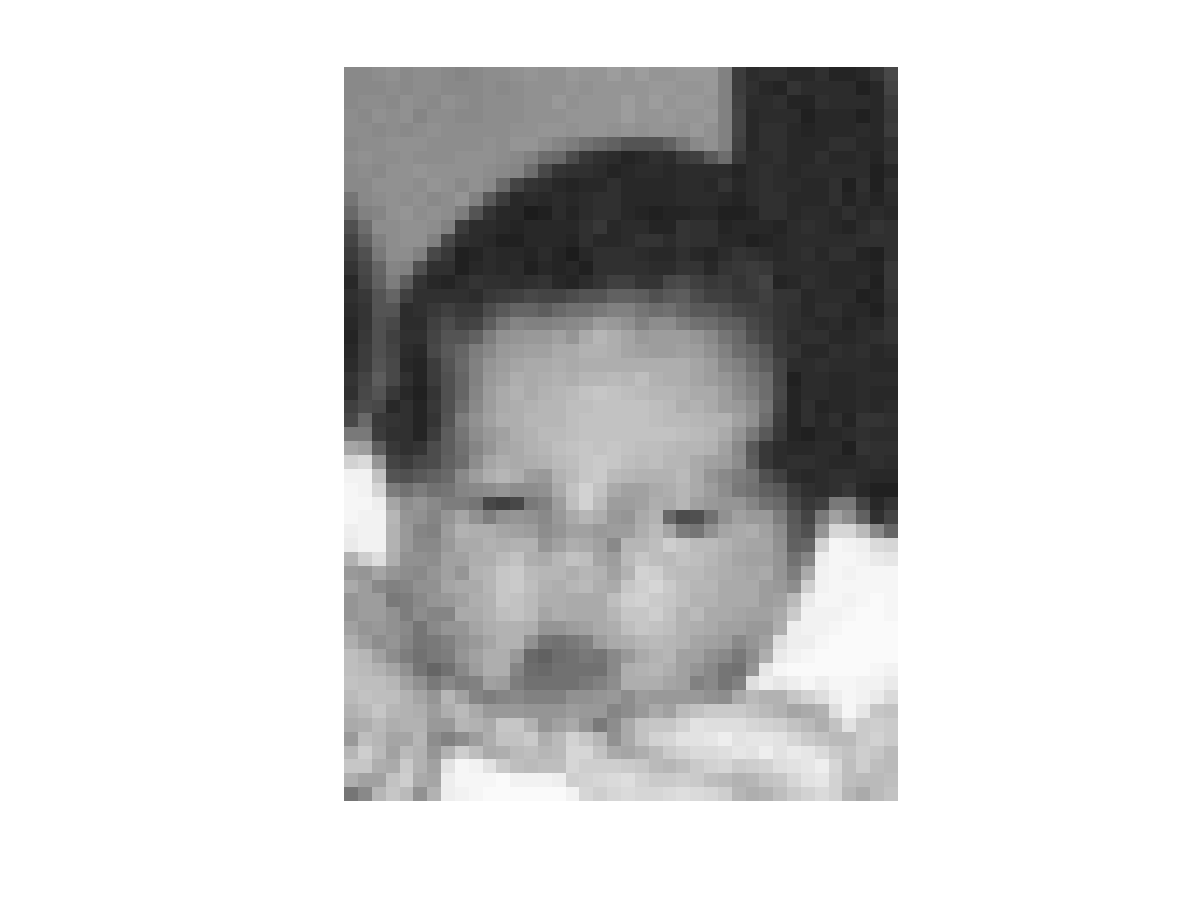
The following code
 clf;
 imshow ("default.img");
Produces the following figure
| Figure 1 |
|---|
 |
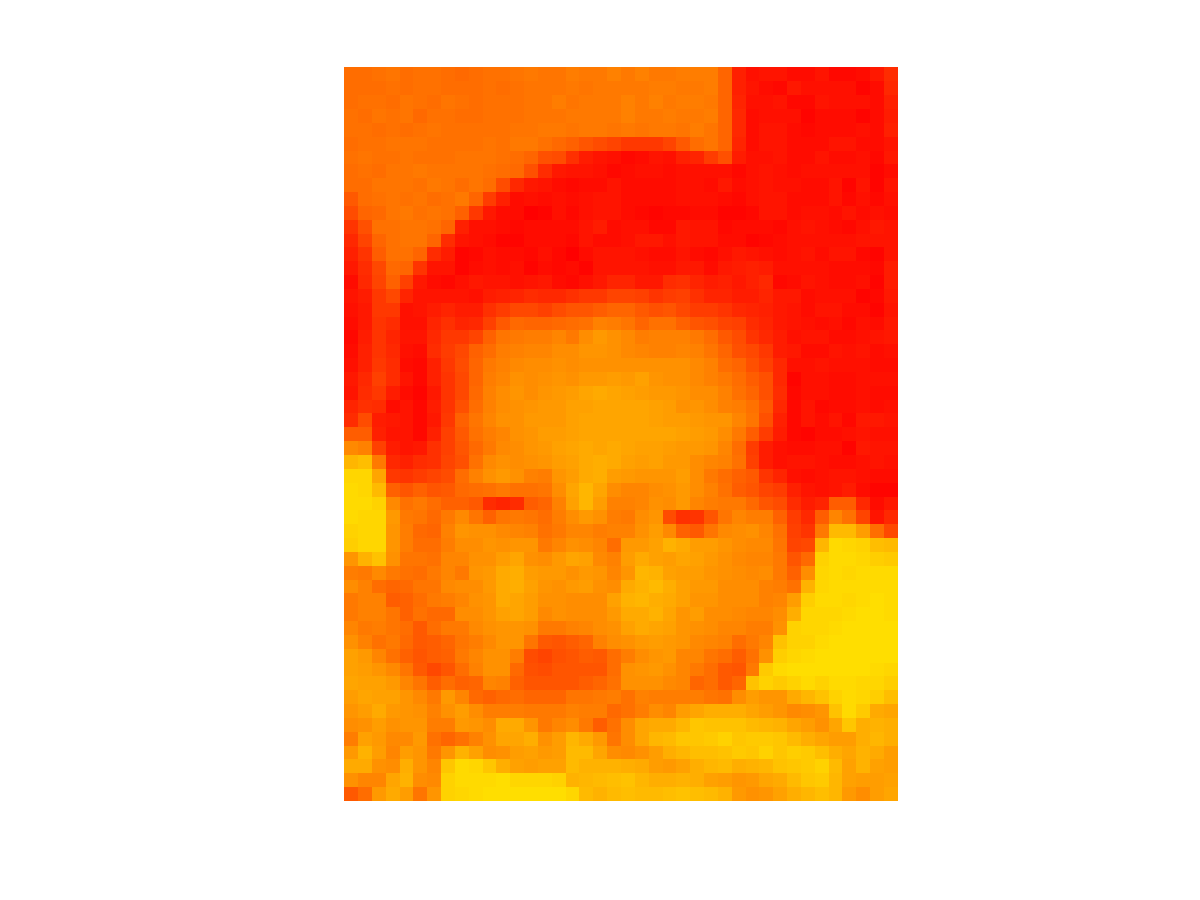
The following code
 clf;
 imshow ("default.img");
 colormap (autumn (64));
Produces the following figure
| Figure 1 |
|---|
 |
The following code
 clf;
 [I, M] = imread ("default.img");
 imshow (I, M);
Produces the following figure
| Figure 1 |
|---|
 |
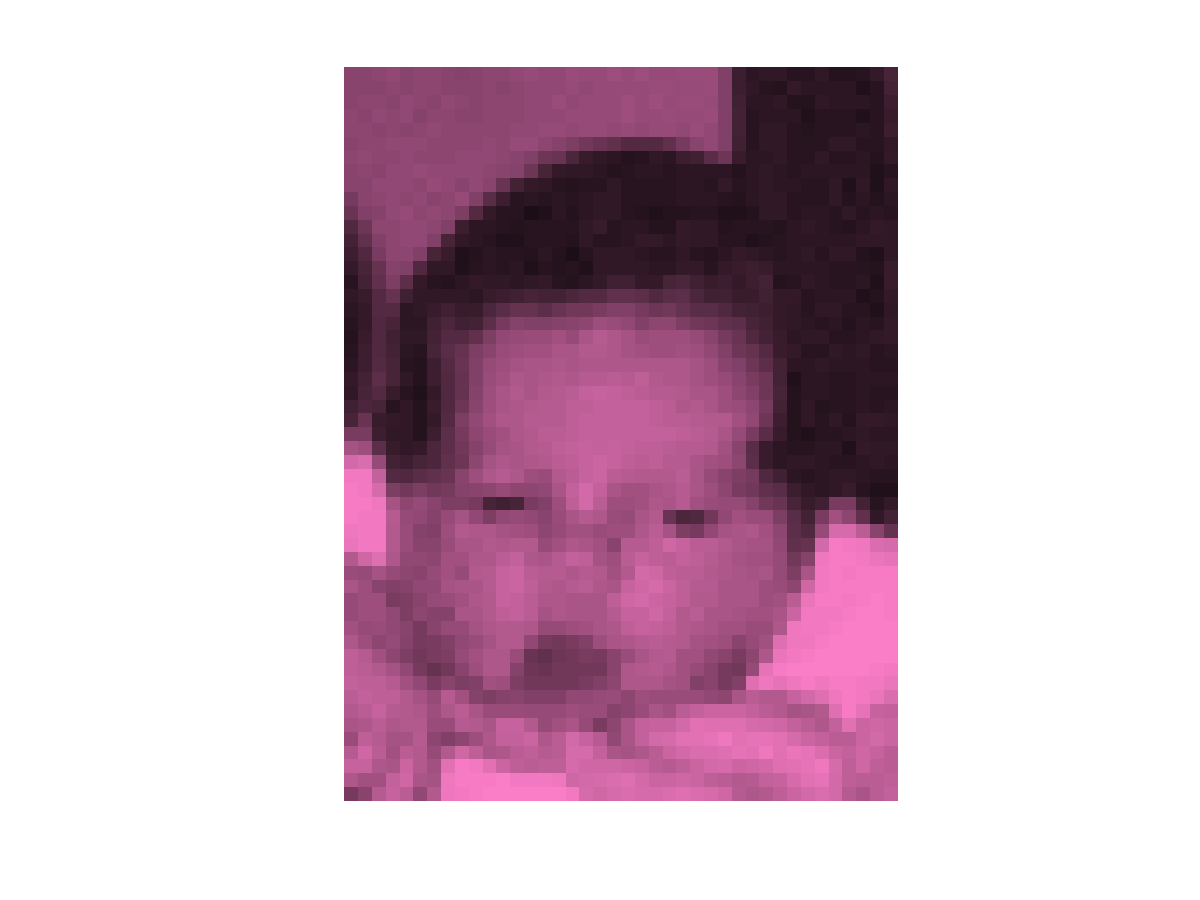
The following code
 clf;
 [I, M] = imread ("default.img");
 [R, G, B] = ind2rgb (I, M);
 imshow (cat (3, R, G*0.5, B*0.8));
Produces the following figure
| Figure 1 |
|---|
 |
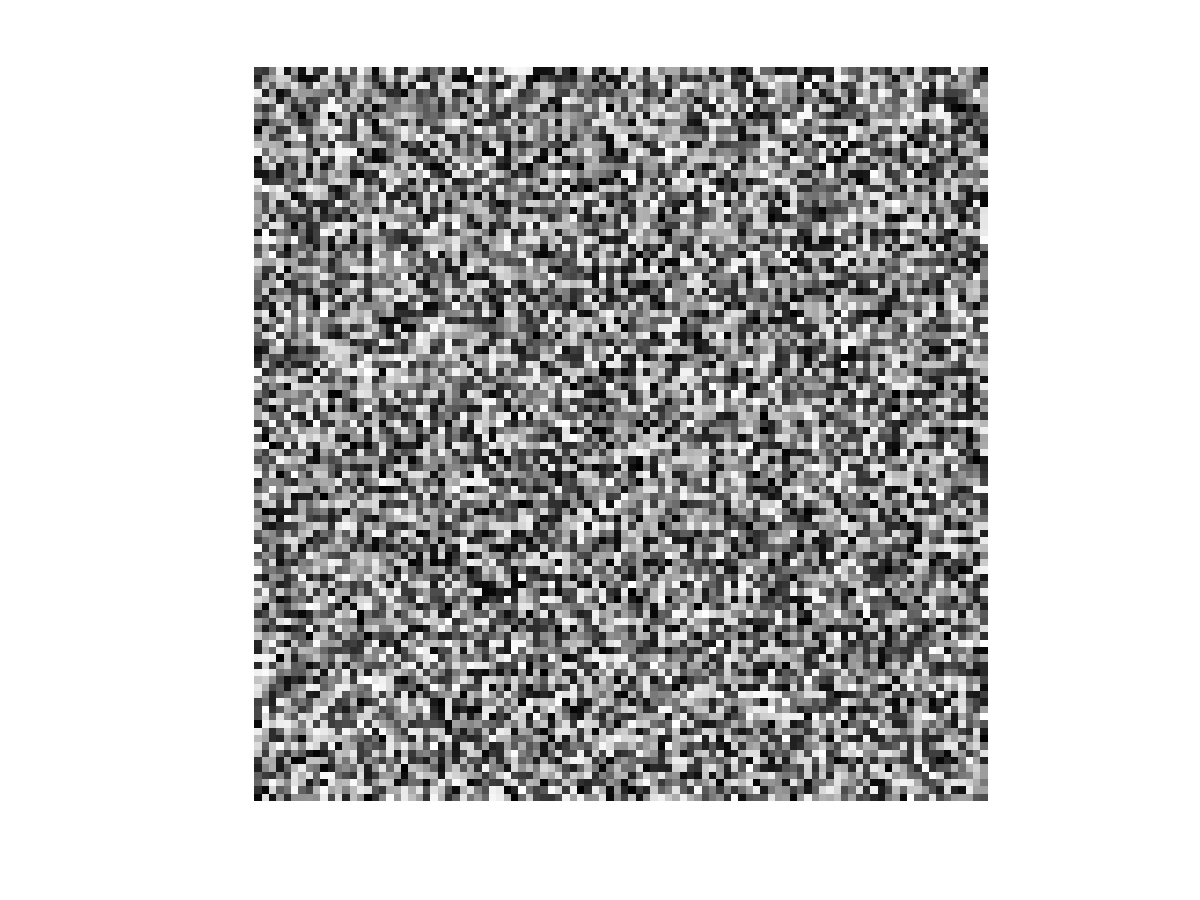
The following code
 clf;
 imshow (rand (100, 100));
Produces the following figure
| Figure 1 |
|---|
 |
The following code
 clf;
 imshow (rand (100, 100, 3));
Produces the following figure
| Figure 1 |
|---|
 |
The following code
 clf;
 imshow (100*rand (100, 100, 3));
Produces the following figure
| Figure 1 |
|---|
 |
The following code
 clf;
 imshow (rand (100, 100));
 colormap (jet (64));
Produces the following figure
| Figure 1 |
|---|
 |
Package: octave