
|
Octave-Forge - Extra packages for GNU Octave |
| Home · Packages · Developers · Documentation · FAQ · Bugs · Mailing Lists · Links · Code |
|
|
Octave-Forge - Extra packages for GNU Octave |
| Home · Packages · Developers · Documentation · FAQ · Bugs · Mailing Lists · Links · Code |
Draw a ribbon plot for the columns of y vs. x.
The optional parameter width specifies the width of a single ribbon
(default is 0.75). If x is omitted, a vector containing the
row numbers is assumed (1:rows (Y)).
If the first argument hax is an axes handle, then plot into this axis,
rather than the current axes returned by gca.
The optional return value h is a vector of graphics handles to the surface objects representing each ribbon.
See also: surface, waterfall.
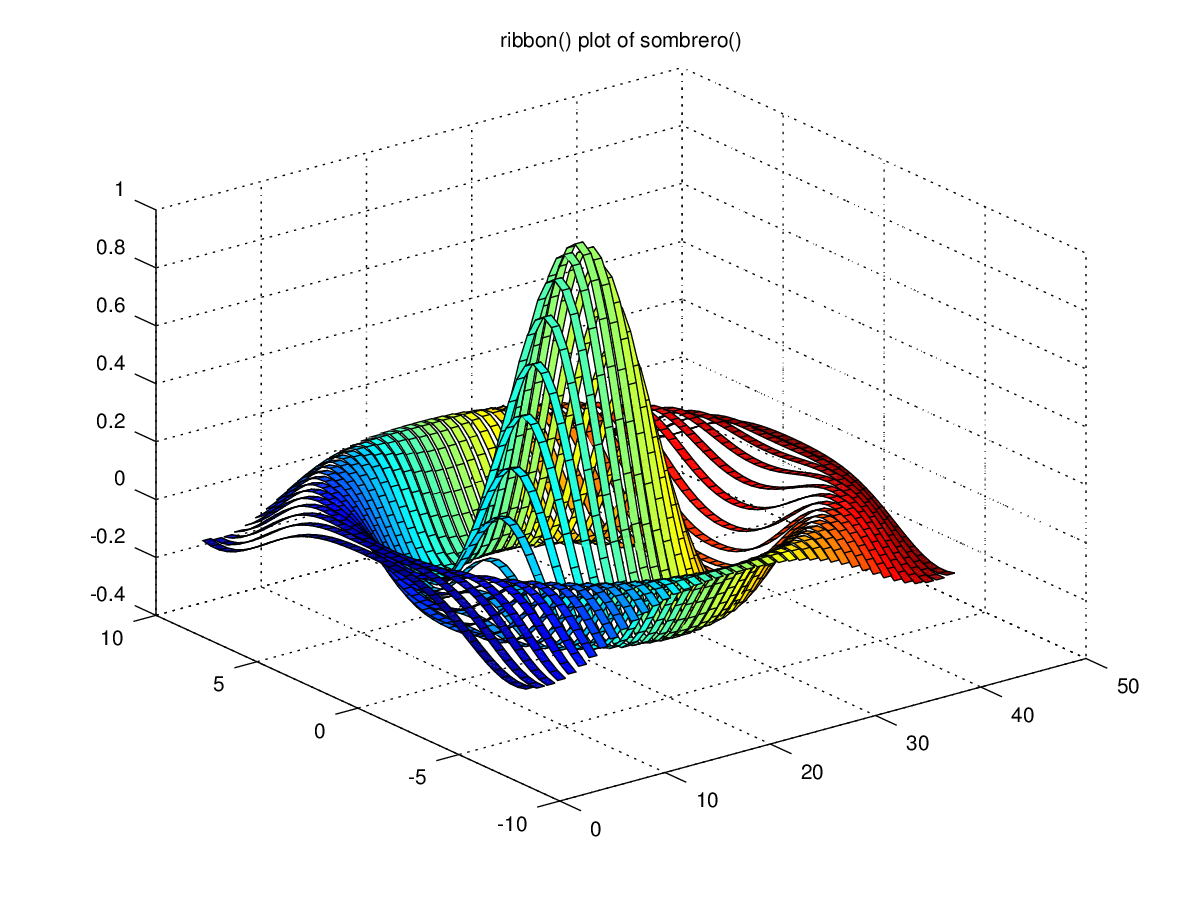
The following code
 clf;
 colormap ('default');
 [x, y, z] = sombrero ();
 ribbon (y, z);
 title ('ribbon() plot of sombrero()');
Produces the following figure
| Figure 1 |
|---|
 |
Package: octave