
|
Octave-Forge - Extra packages for GNU Octave |
| Home · Packages · Developers · Documentation · FAQ · Bugs · Mailing Lists · Links · Code |
|
|
Octave-Forge - Extra packages for GNU Octave |
| Home · Packages · Developers · Documentation · FAQ · Bugs · Mailing Lists · Links · Code |
Produce a 2-D plot using a logarithmic scale for the y-axis.
See the documentation of plot for a description of the
arguments that semilogy will accept.
If the first argument hax is an axes handle, then plot into this axis,
rather than the current axes returned by gca.
The optional return value h is a graphics handle to the created plot.
See also: plot, semilogx, loglog.
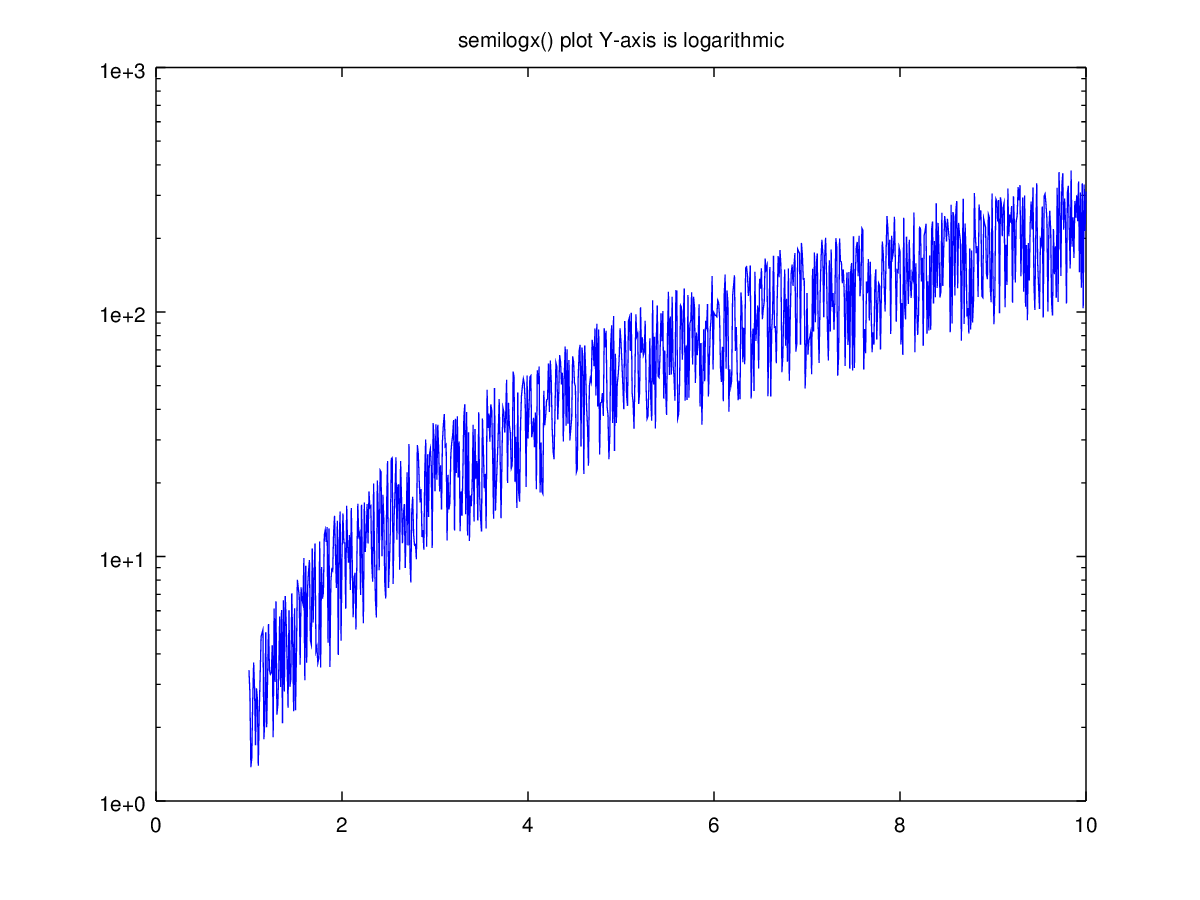
The following code
 clf;
 x = 1:0.01:10;
 y = (x .* (1 + rand (size (x)))) .^ 2;
 semilogy (x, y);
 title ({'semilogx() plot', 'Y-axis is logarithmic'});
Produces the following figure
| Figure 1 |
|---|
 |
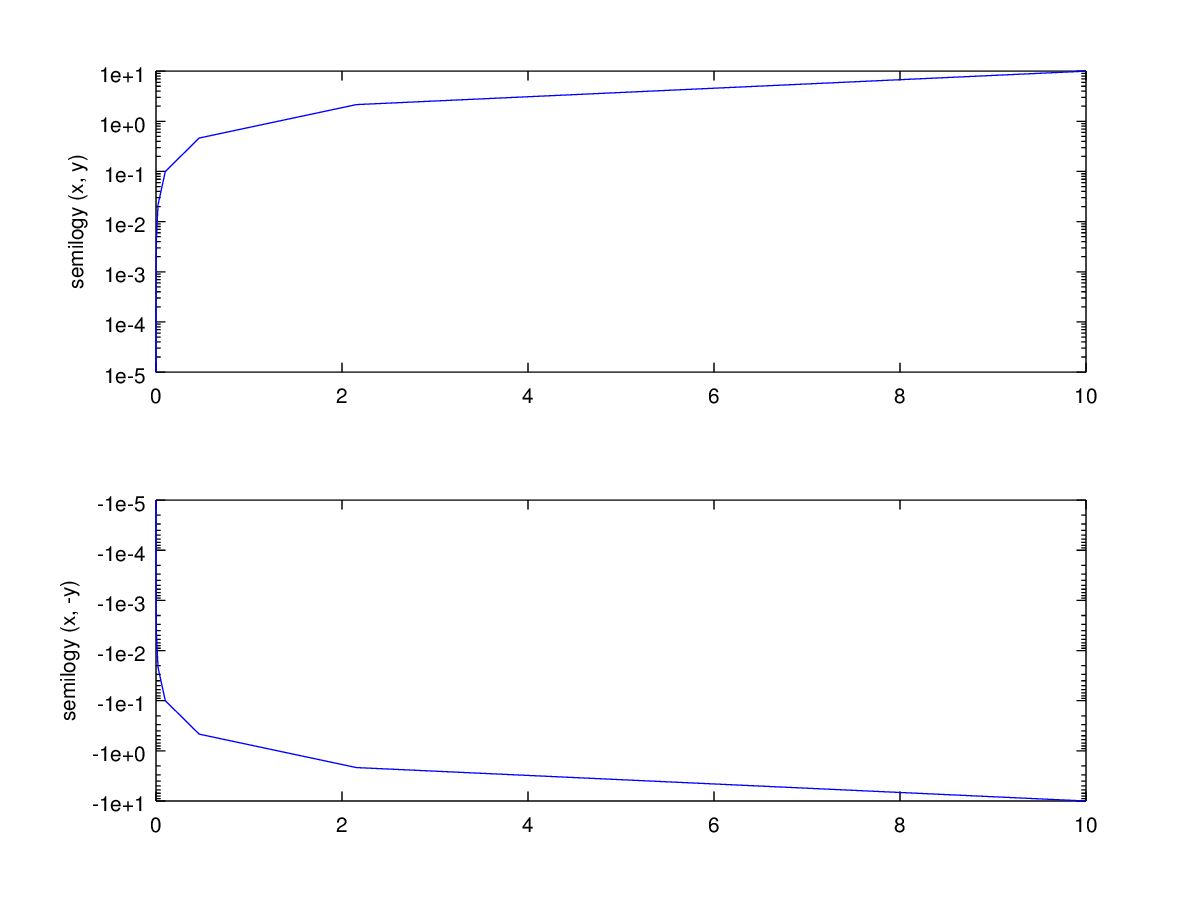
The following code
 clf;
 x = logspace (-5, 1, 10);
 y = logspace (-5, 1, 10);

 subplot (2,1,1);
  semilogy (x, y);
  ylabel ('semilogy (x, y)');

 subplot (2,1,2);
  semilogy (x, -y);
  ylabel ('semilogy (x, -y)');
Produces the following figure
| Figure 1 |
|---|
 |
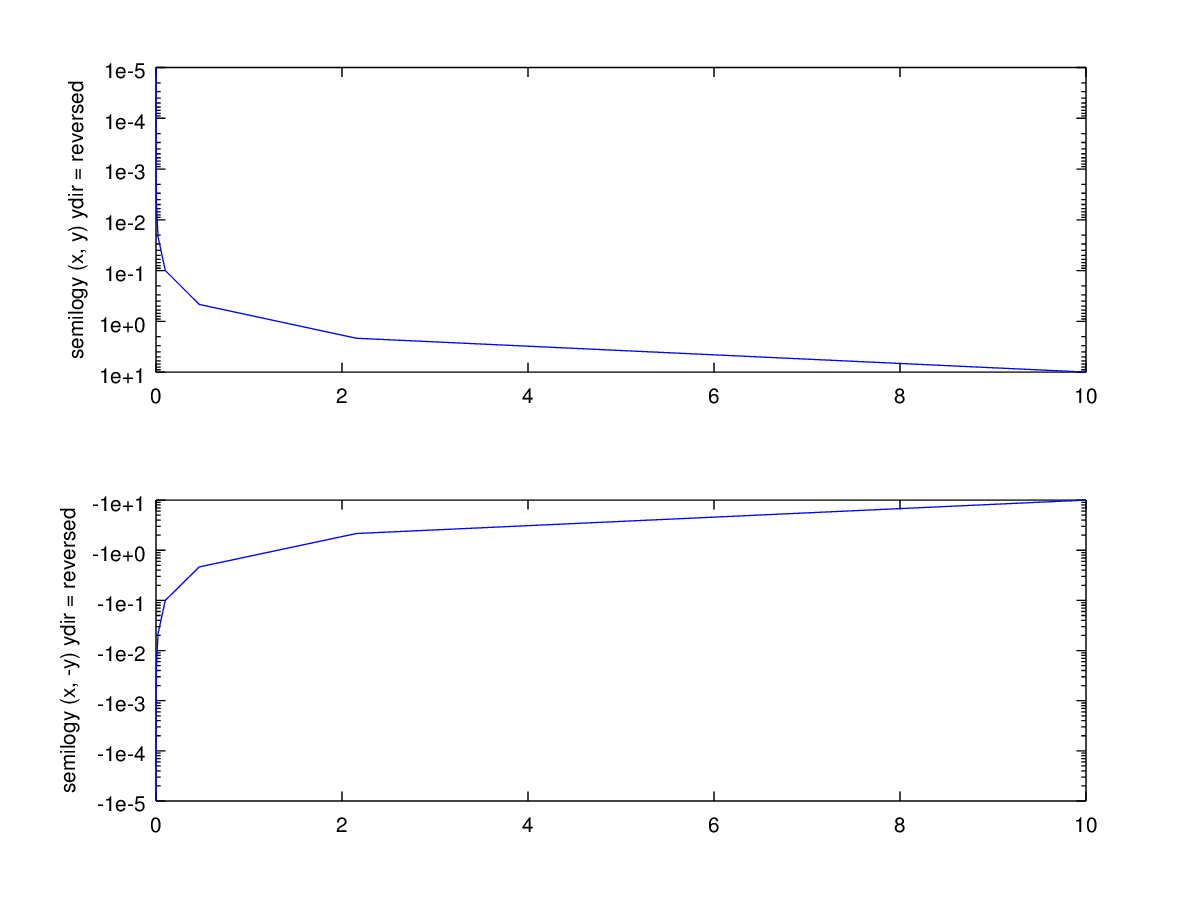
The following code
 clf;
 x = logspace (-5, 1, 10);
 y = logspace (-5, 1, 10);

 subplot (2,1,1);
  semilogy (x, y);
  set (gca, 'ydir', 'reverse', 'activepositionproperty', 'outerposition');
  ylabel ({'semilogy (x, y)', 'ydir = reversed'});

 subplot (2,1,2);
  semilogy (x, -y);
  set (gca, 'ydir', 'reverse', 'activepositionproperty', 'outerposition');
  ylabel ({'semilogy (x, -y)', 'ydir = reversed'});
Produces the following figure
| Figure 1 |
|---|
 |
Package: octave