
|
Octave-Forge - Extra packages for GNU Octave |
| Home · Packages · Developers · Documentation · FAQ · Bugs · Mailing Lists · Links · Code |
|
|
Octave-Forge - Extra packages for GNU Octave |
| Home · Packages · Developers · Documentation · FAQ · Bugs · Mailing Lists · Links · Code |
Plot a 3-D stem graph.
Stems are drawn from the height z to the location in the x-y plane
determined by x and y. The default color is "b" (blue),
the default line style is "-", and the default marker is "o".
The line style can be altered by the linespec argument in the same
manner as the plot command. If the "filled" argument is
present the markers at the top of the stems will be filled in.
Optional property/value pairs may be specified to control the appearance of the plot.
If the first argument hax is an axes handle, then plot into this axis,
rather than the current axes returned by gca.
The optional return value h is a handle to the "stem series" hggroup containing the line and marker objects used for the plot. See ‘stem’, for a description of the "stem series" object.
Example:
theta = 0:0.2:6;
stem3 (cos (theta), sin (theta), theta);
plots 31 stems with heights from 0 to 6 lying on a circle.
Implementation Note: Color definitions with RGB-triples are not valid.
See also: stem, bar, hist, plot.
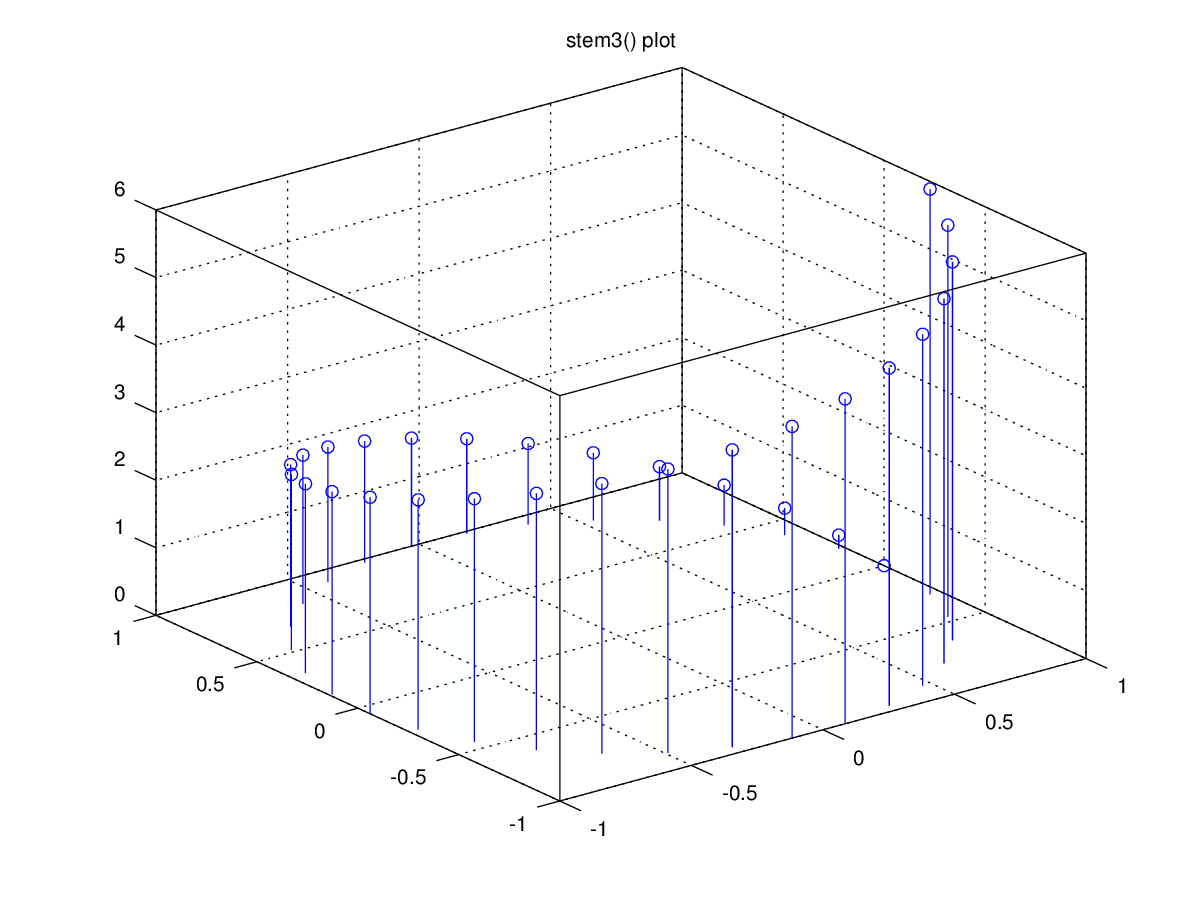
The following code
 clf;
 theta = 0:0.2:6;
 stem3 (cos (theta), sin (theta), theta);
 title ('stem3() plot');
Produces the following figure
| Figure 1 |
|---|
 |
Package: octave