
|
Octave-Forge - Extra packages for GNU Octave |
| Home · Packages · Developers · Documentation · FAQ · Bugs · Mailing Lists · Links · Code |
|
|
Octave-Forge - Extra packages for GNU Octave |
| Home · Packages · Developers · Documentation · FAQ · Bugs · Mailing Lists · Links · Code |
Query or set the limits of the x-axis for the current plot.
Called without arguments xlim returns the x-axis limits of the
current plot.
With the input query "mode", return the current x-limit
calculation mode which is either "auto" or "manual".
If passed a 2-element vector [x_lo x_hi], the limits of the
x-axis are set to these values and the mode is set to "manual".
The current plotting mode can be changed by using either "auto"
or "manual" as the argument.
If the first argument hax is an axes handle, then operate on
this axis rather than the current axes returned by gca.
See also: ylim, zlim, axis, set, get, gca.
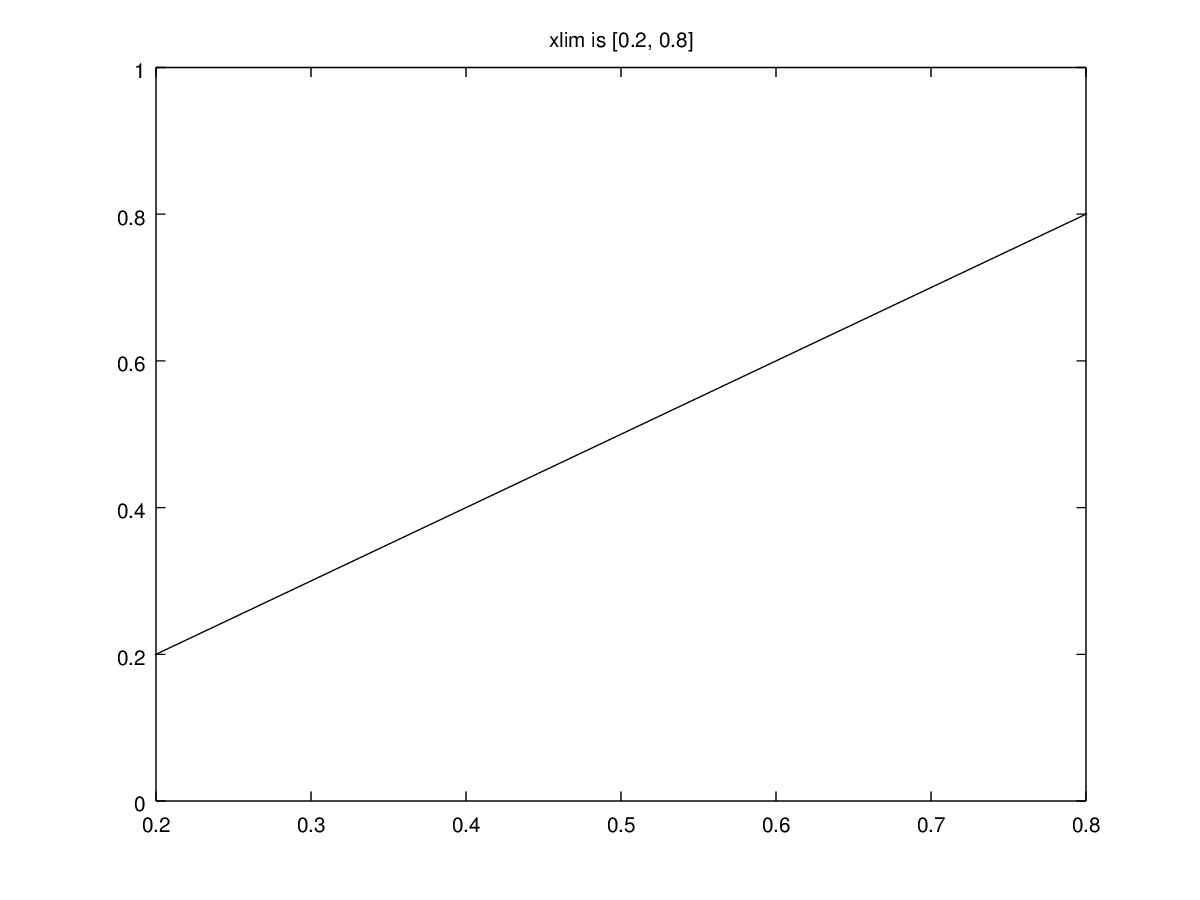
The following code
 clf;
 line ();
 xlim ([0.2, 0.8]);
 title ('xlim is [0.2, 0.8]');
 assert (xlim (), [0.2, 0.8]);
Produces the following figure
| Figure 1 |
|---|
 |
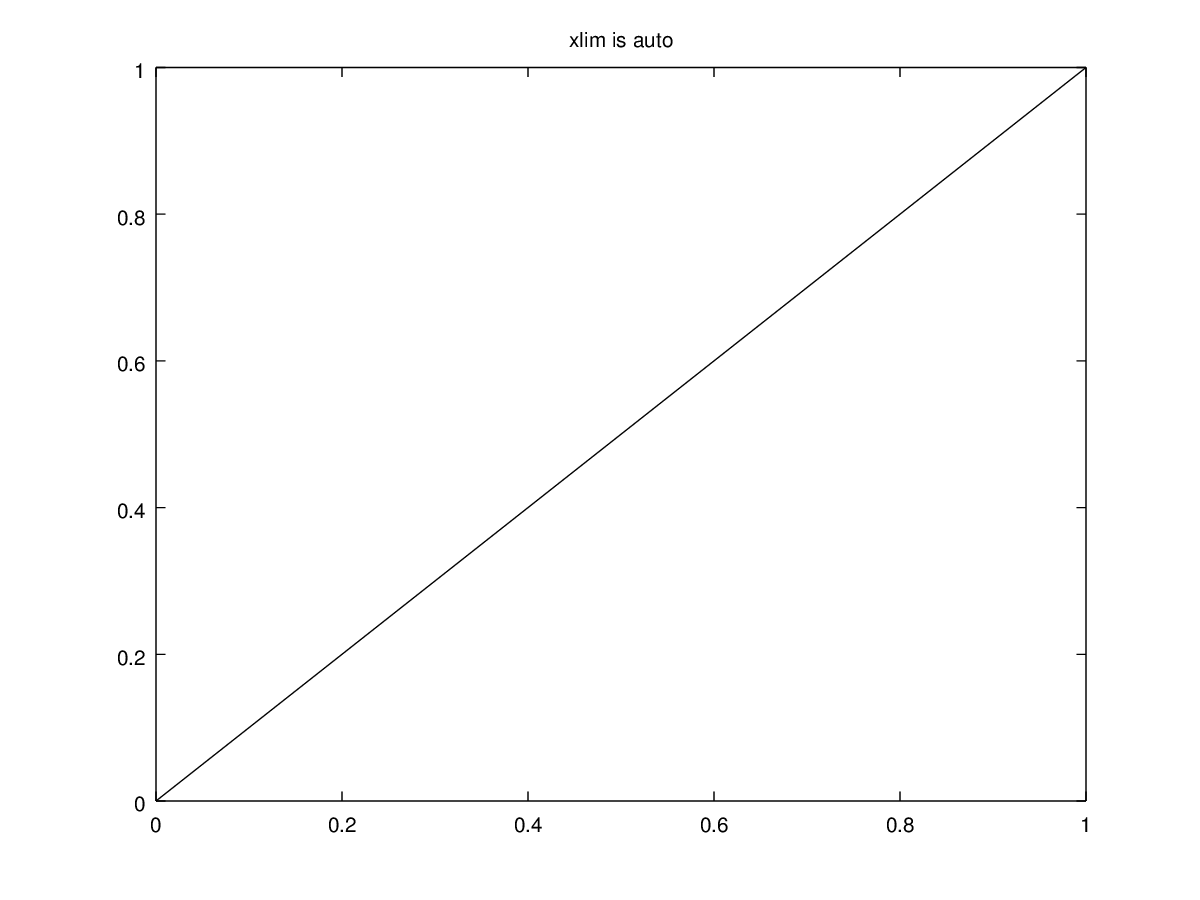
The following code
 clf;
 line ();
 xlim ('auto');
 title ('xlim is auto');
 assert (xlim ('mode'), 'auto');
Produces the following figure
| Figure 1 |
|---|
 |
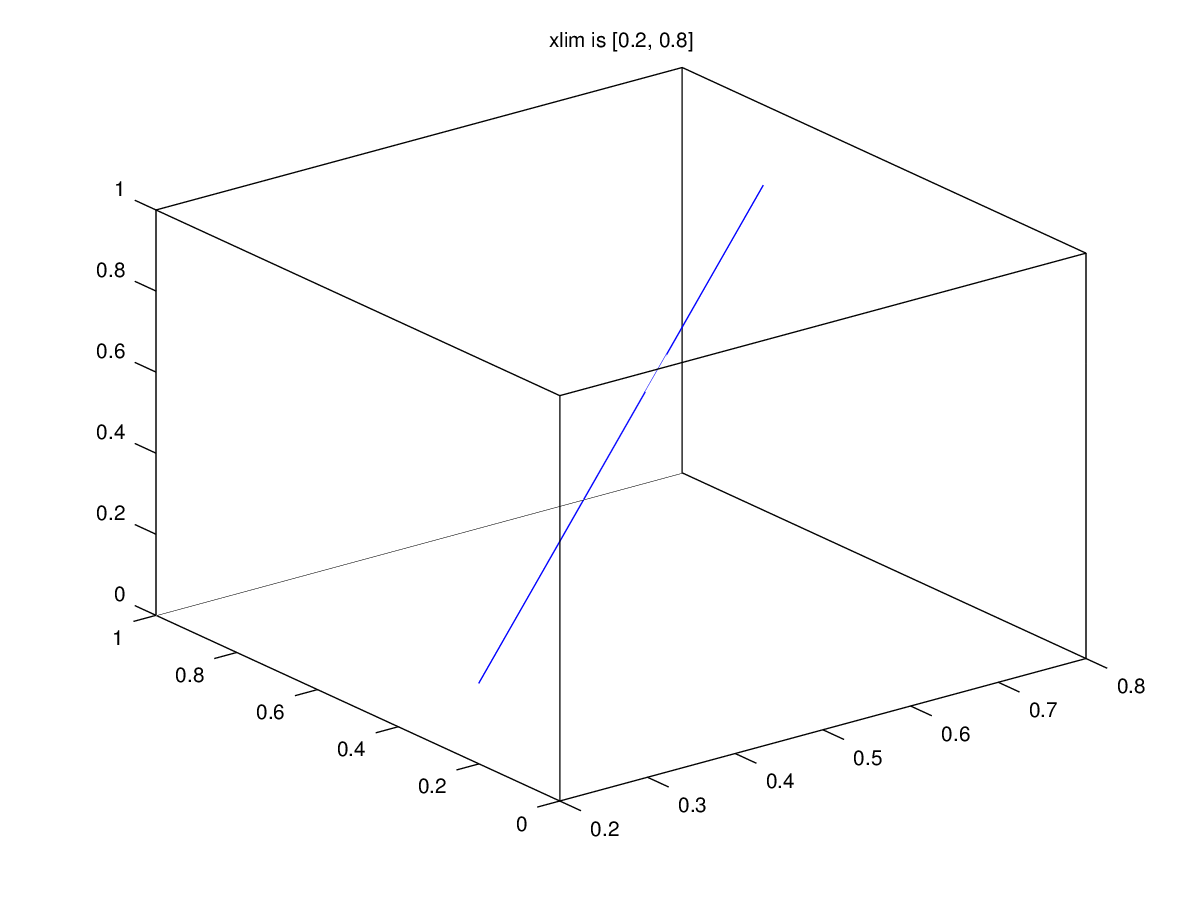
The following code
 clf;
 plot3 ([0,1], [0,1], [0,1]);
 xlim ([0.2, 0.8]);
 title ('xlim is [0.2, 0.8]');
 assert (xlim (), [0.2, 0.8]);
Produces the following figure
| Figure 1 |
|---|
 |
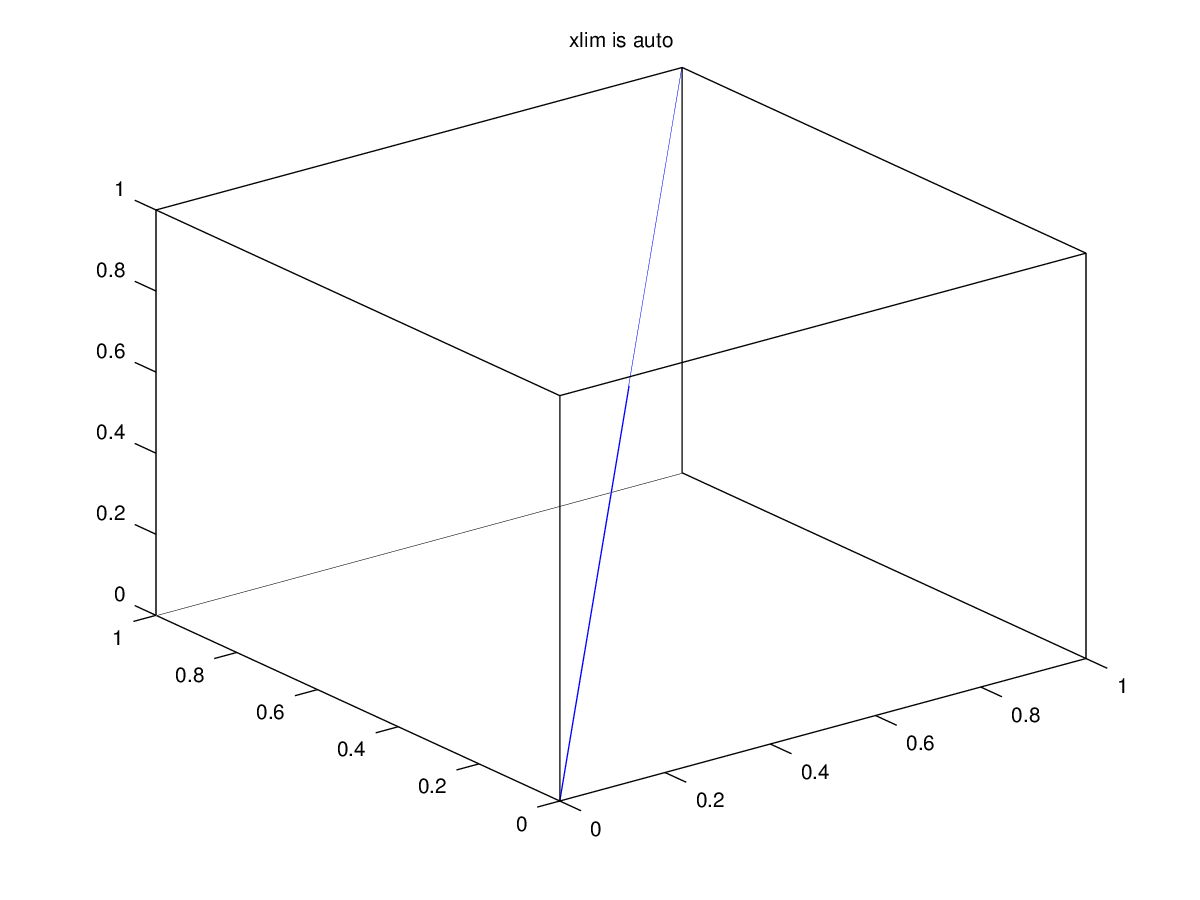
The following code
 clf;
 plot3 ([0,1], [0,1], [0,1]);
 xlim ('auto');
 title ('xlim is auto');
 assert (xlim ('mode'), 'auto');
Produces the following figure
| Figure 1 |
|---|
 |
Package: octave