
|
Octave-Forge - Extra packages for GNU Octave |
| Home · Packages · Developers · Documentation · FAQ · Bugs · Mailing Lists · Links · Code |
|
|
Octave-Forge - Extra packages for GNU Octave |
| Home · Packages · Developers · Documentation · FAQ · Bugs · Mailing Lists · Links · Code |
Create a light object in the current axes or for axes hax.
When a light object is present in an axes object, and the properties
"EdgeLighting" or "FaceLighting" of a patch or
surface object are set to a value other than "none", these
objects are drawn with light and shadow effects. Supported values for
Lighting properties are "none" (no lighting effects), "flat"
(faceted look of the objects), and "gouraud" (linear interpolation
of the lighting effects between the vertices). For patch objects,
the normals must be set manually (property "VertexNormals").
Up to eight light objects are supported per axes.
Lighting is only supported for OpenGL graphic toolkits (i.e., "fltk"
and "qt").
A light object has the following properties which alter the appearance of the plot.
"Color": The color of the light can be passed as anRGB-vector (e.g., [1 0 0] for red) or as a string (e.g., "r"
for red). The default color is white ([1 1 1]).
"Position": The direction from which the light emanates as a1x3-vector. The default direction is [1 0 1].
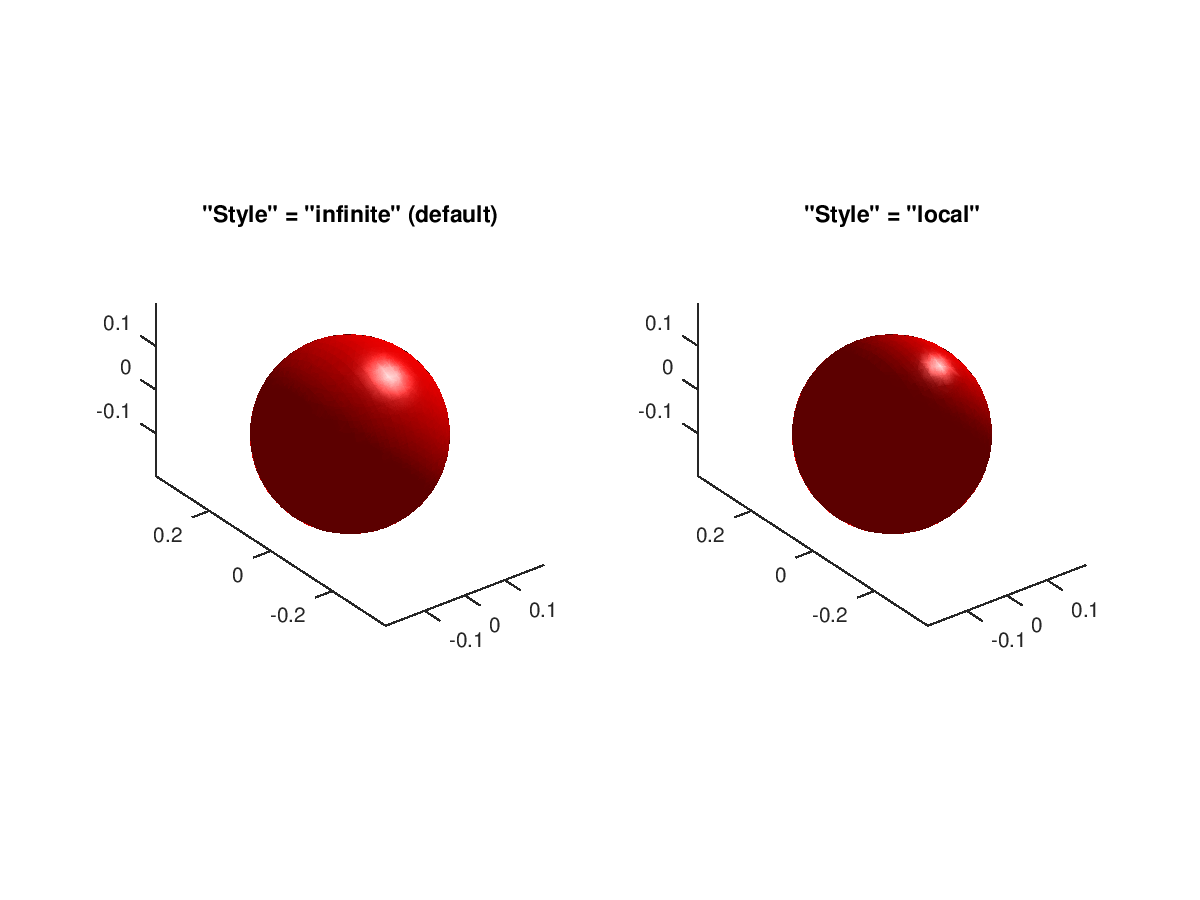
"Style": This string defines whether the light emanates from alight source at infinite distance ("infinite") or from a local point
source ("local"). The default is "infinite".
If the first argument hax is an axes handle, then add the light object
to this axes, rather than the current axes returned by gca.
The optional return value h is a graphics handle to the created light object.
See also: lighting, material, patch, surface.
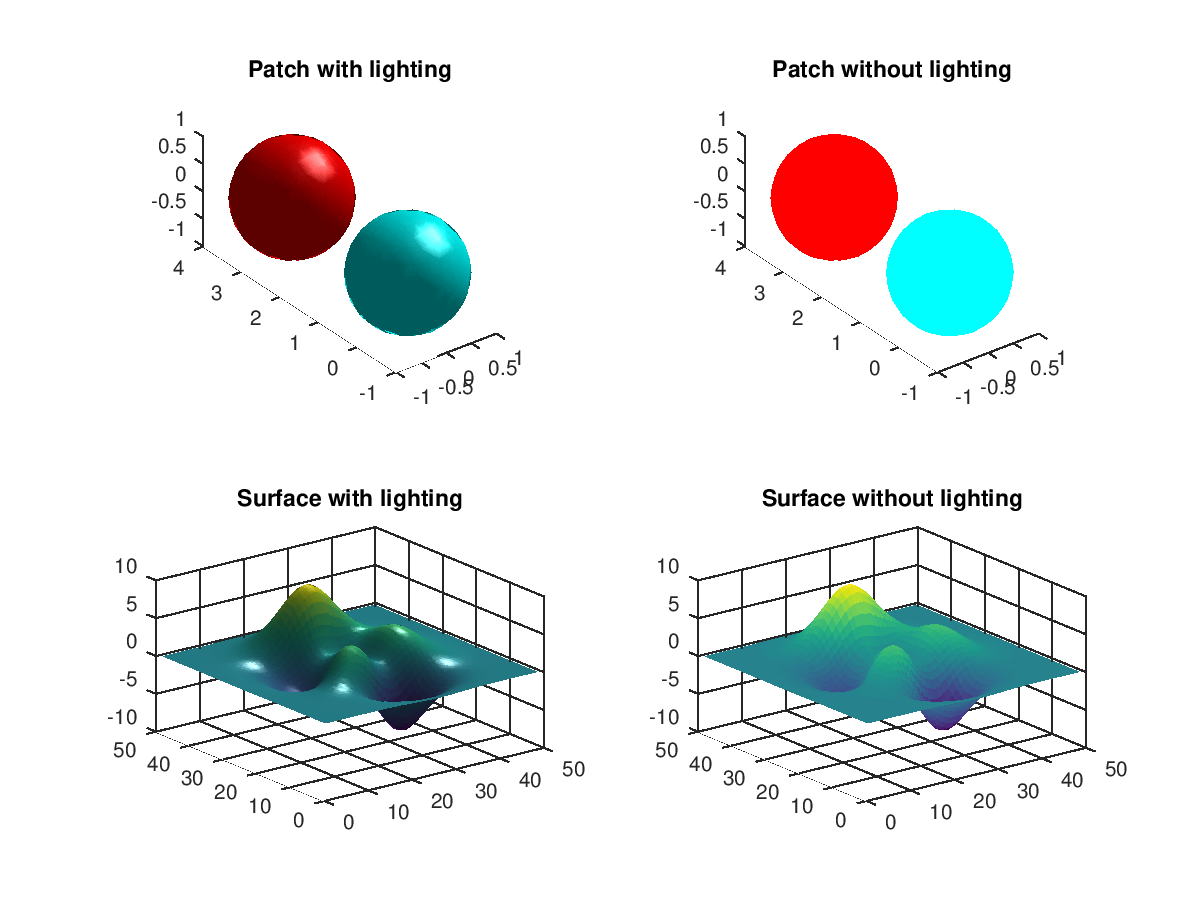
The following code
 ## Demonstrate effects of lighting
 clf;
 ## patches
 h_axes1 = subplot (2, 2, 1);
 [x,y,z] = meshgrid (-2:0.2:2, -2:0.2:2, -2:0.2:2);
 val = x.^2 + y.^2 + z.^2;
 fv1 = isosurface (x, y, z, val, 1);
 h_patch1 = patch (fv1, "FaceColor", "c", "EdgeColor", "none", ...
                        "FaceLighting", "Gouraud");
 isonormals (x, y, z, val, h_patch1);
 fv2 = isosurface (x, y+3, z, val, 1);
 h_patch2 = patch (fv2, "FaceColor", "r", "EdgeColor", "none", ...
                        "FaceLighting", "Gouraud");
 isonormals (x, y+3, z, val, h_patch2);
 axis equal; axis tight
 title ("Patch with lighting");
 view (3);
 h_light1 = light ();

 h_axes2 = subplot (2, 2, 2);
 patch (fv1, "FaceColor", "c", "EdgeColor", "none");
 patch (fv2, "FaceColor", "r", "EdgeColor", "none");
 axis equal; axis tight
 title ("Patch without lighting");
 view (3);

 ## surfaces
 h_axes3 = subplot (2, 2, 3);
 h_surf1 = surf (h_axes3, peaks, "LineStyle", "none", ...
                                 "FaceLighting", "Gouraud");
 title ("Surface with lighting");
 view (3);
 h_light2 = light ();

 h_axes3 = subplot (2, 2, 4);
 h_surf2 = surf (h_axes3, peaks, "LineStyle", "none");
 title ("Surface without lighting");
 view (3);
Produces the following figure
| Figure 1 |
|---|
 |
The following code
 ## Lighting modes
 clf;
 [x,y,z] = meshgrid (-.2:0.05:.2, -.2:0.05:.2, -.2:0.05:.2);
 val = (x.^2 + y.^2 + z.^2);

 h_axes1 = axes ();
 fv = isosurface (x, y, z, val, .039);
 h_patch = patch (fv, "FaceColor", "r", "EdgeColor", "none", ...
                      "FaceLighting", "none");
 isonormals (x, y, z, val, h_patch);
 fv = isosurface (x+.5, y, z, val, .039);
 h_patch = patch (fv, "FaceColor", "r", "EdgeColor", "none", ...
                      "FaceLighting", "flat");
 isonormals (x+.5, y, z, val, h_patch)
 fv = isosurface (x+1, y, z, val, .039);
 h_patch = patch (fv, "FaceColor", "r", "EdgeColor", "none", ...
                      "FaceLighting", "Gouraud");
 isonormals (x+1, y, z, val, h_patch);
 axis tight
 axis equal
 view (2);
 light ("Position", [-1 1 1]);
 title ({"FaceLighting", "none - flat - gouraud"});
Produces the following figure
| Figure 1 |
|---|
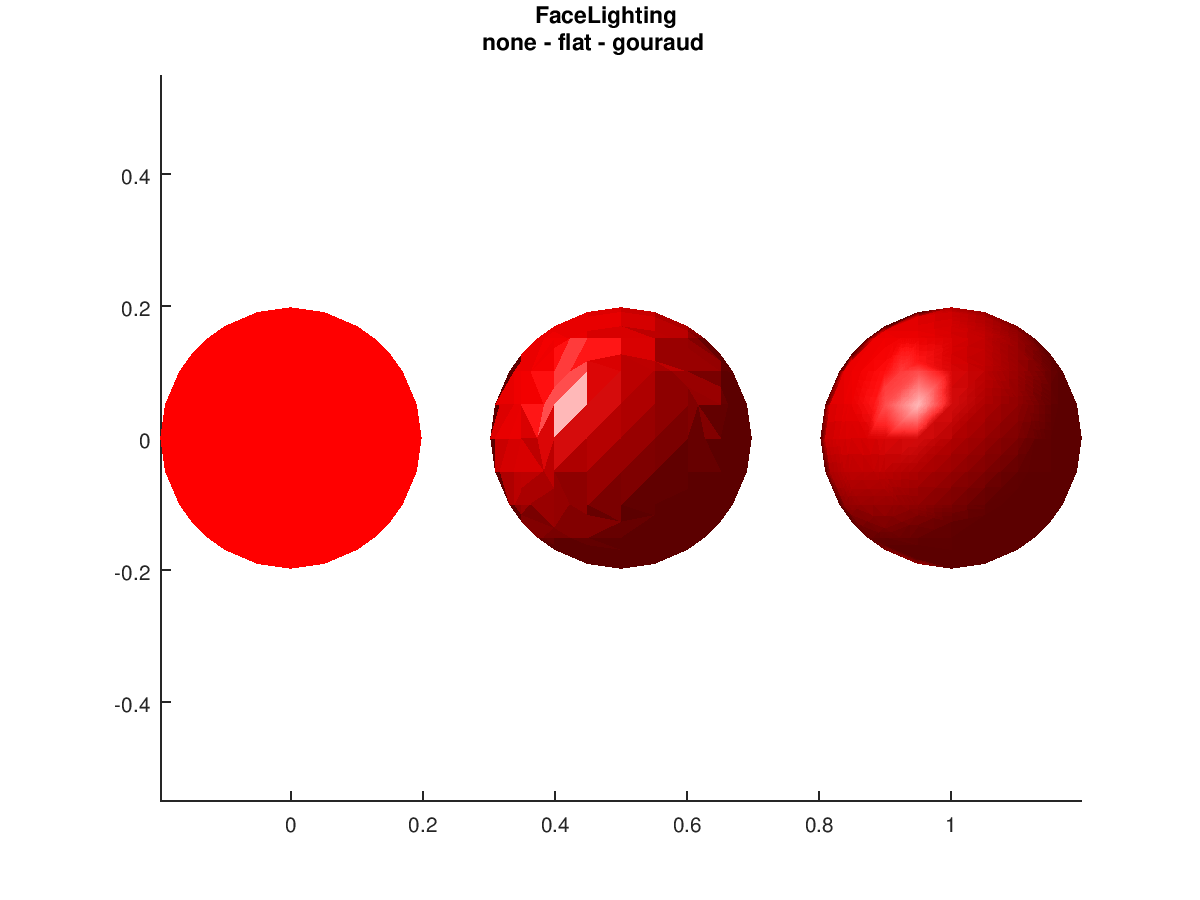 |
The following code
 ## multiple lights
 clf;
 h_axes = subplot (1, 2, 1);
 [x,y,z] = meshgrid (-2:0.1:2, -2:0.1:2, -2:0.1:2);
 val = x.^2 + y.^2 + z.^2;
 fv = isosurface (x, y, z, val, 1);
 h_patch = patch (fv, "FaceColor", "w", "EdgeColor", "none", ...
                      "FaceLighting", "Gouraud");
 isonormals (x, y, z, val, h_patch);
 axis equal; axis tight
 title ("Patch with one light");
 view (3);
 h_light = light ("Color", "g");

 h_axes2 = subplot (1, 2, 2);
 h_patch2 = patch (fv, "FaceColor", "w", "EdgeColor", "none", ...
                       "FaceLighting", "Gouraud");
 isonormals (x, y, z, val, h_patch2);
 axis equal; axis tight
 title ("Patch with three lights");
 view (3);
 h_light1 = light ("Color", "r");
 h_light2 = light ("Position", [0 1 1], "Color", "b");
 h_light3 = light ("Position", [-1 -1 2], "Color", "g");
Produces the following figure
| Figure 1 |
|---|
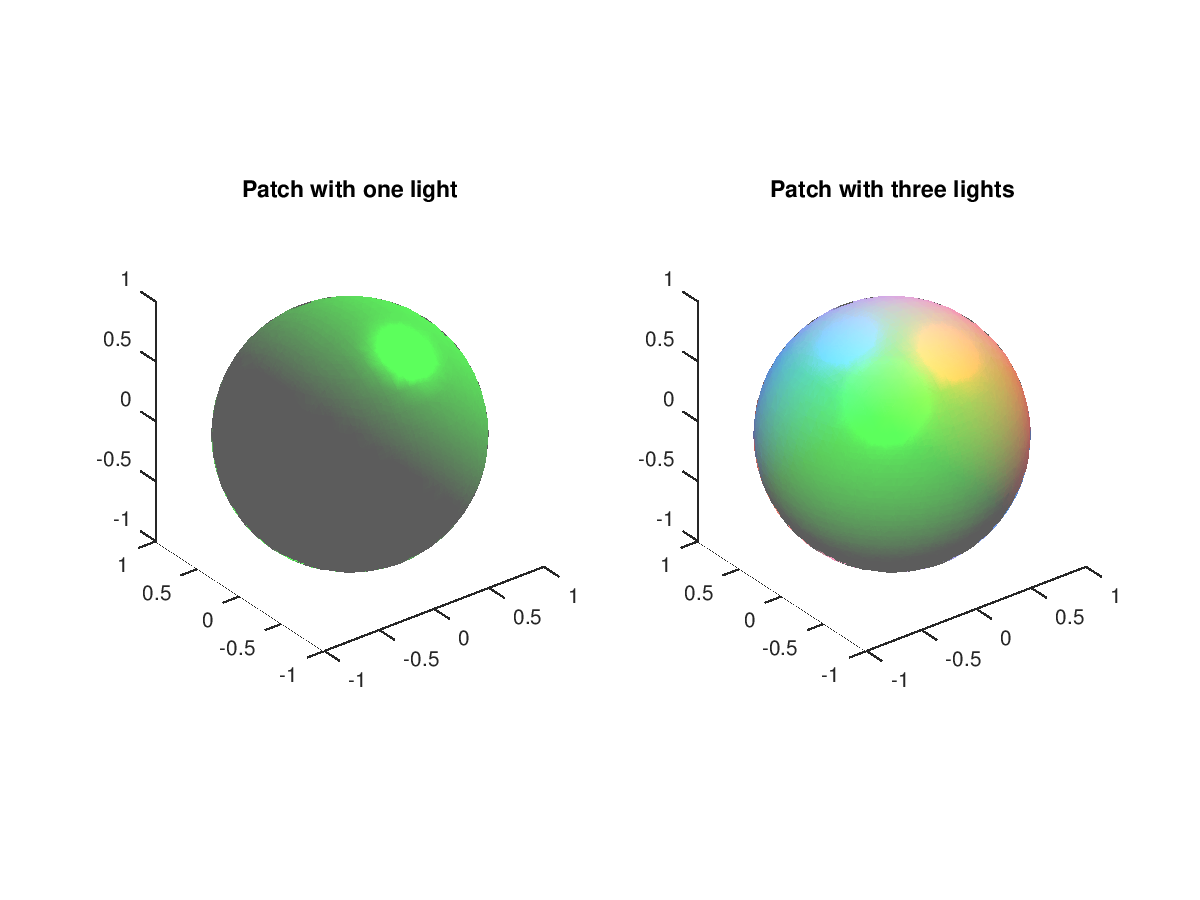 |
The following code
 ## Diffuse and specular reflection
 clf;
 h_axes = axes ();
 [x,y,z] = meshgrid (-.2:0.04:.2, -.2:0.04:.2, -.2:0.04:.2);
 val = (x.^2 + y.^2 + z.^2);

 fv = isosurface (x, y, z, val, .039);
 h_patch = patch (fv, "FaceColor", "r", "EdgeColor", "none", ...
                      "FaceLighting", "Gouraud");
 set (h_patch, "DiffuseStrength", 0, "SpecularStrength", 0);
 isonormals (x, y, z, val, h_patch);
 fv = isosurface (x+.5, y, z, val, .039);
 h_patch = patch (fv, "FaceColor", "r", "EdgeColor", "none", ...
                      "FaceLighting", "Gouraud");
 set (h_patch, "DiffuseStrength", 0, "SpecularStrength", .5);
 isonormals (x+.5, y, z, val, h_patch);
 fv = isosurface (x+1, y, z, val, .039);
 h_patch = patch (fv, "FaceColor", "r", "EdgeColor", "none", ...
                      "FaceLighting", "Gouraud");
 set (h_patch, "DiffuseStrength", 0, "SpecularStrength", 1);
 isonormals (x+1, y, z, val, h_patch);

 fv = isosurface (x, y+.5, z, val, .039);
 h_patch = patch (fv, "FaceColor", "r", "EdgeColor", "none", ...
                      "FaceLighting", "Gouraud");
 set (h_patch, "DiffuseStrength", 0.5, "SpecularStrength", 0);
 isonormals (x, y+.5, z, val, h_patch);
 fv = isosurface (x+.5, y+.5, z, val, .039);
 h_patch = patch (fv, "FaceColor", "r", "EdgeColor", "none", ...
                      "FaceLighting", "Gouraud");
 set (h_patch, "DiffuseStrength", 0.5, "SpecularStrength", .5);
 isonormals (x+.5, y+.5, z, val, h_patch);
 fv = isosurface (x+1, y+.5, z, val, .039);
 h_patch = patch (fv, "FaceColor", "r", "EdgeColor", "none", ...
                      "FaceLighting", "Gouraud");
 set (h_patch, "DiffuseStrength", 0.5, "SpecularStrength", 1);
 isonormals (x+1, y+.5, z, val, h_patch);

 fv = isosurface (x, y+1, z, val, .039);
 h_patch = patch (fv, "FaceColor", "r", "EdgeColor", "none", ...
                      "FaceLighting", "Gouraud");
 set (h_patch, "DiffuseStrength", 1, "SpecularStrength", 0);
 isonormals (x, y+1, z, val, h_patch);
 fv = isosurface (x+.5, y+1, z, val, .039);
 h_patch = patch (fv, "FaceColor", "r", "EdgeColor", "none", ...
                      "FaceLighting", "Gouraud");
 set (h_patch, "DiffuseStrength", 1, "SpecularStrength", .5);
 isonormals (x+.5, y+1, z, val, h_patch);
 fv = isosurface (x+1, y+1, z, val, .039);
 h_patch = patch (fv, "FaceColor", "r", "EdgeColor", "none", ...
                      "FaceLighting", "Gouraud");
 set (h_patch, "DiffuseStrength", 1, "SpecularStrength", 1);
 isonormals (x+1, y+1, z, val, h_patch);

 axis equal
 h_light = light ("Position", [-1 1 1]);
 view (2);

 xlabel ("SpecularStrength");
 ylabel ("DiffuseStrength");
 title ("Effects of SpecularStrength and DiffuseStrength");
Produces the following figure
| Figure 1 |
|---|
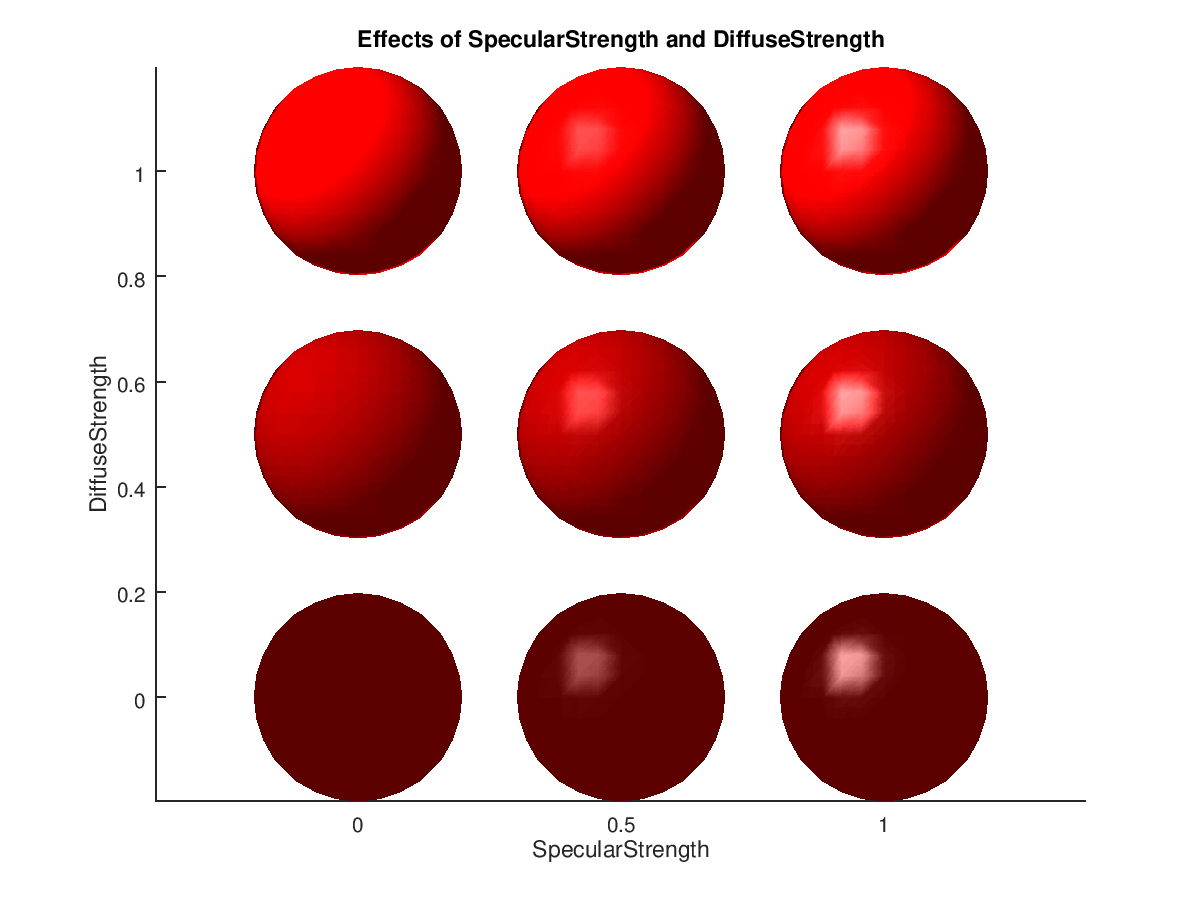 |
The following code
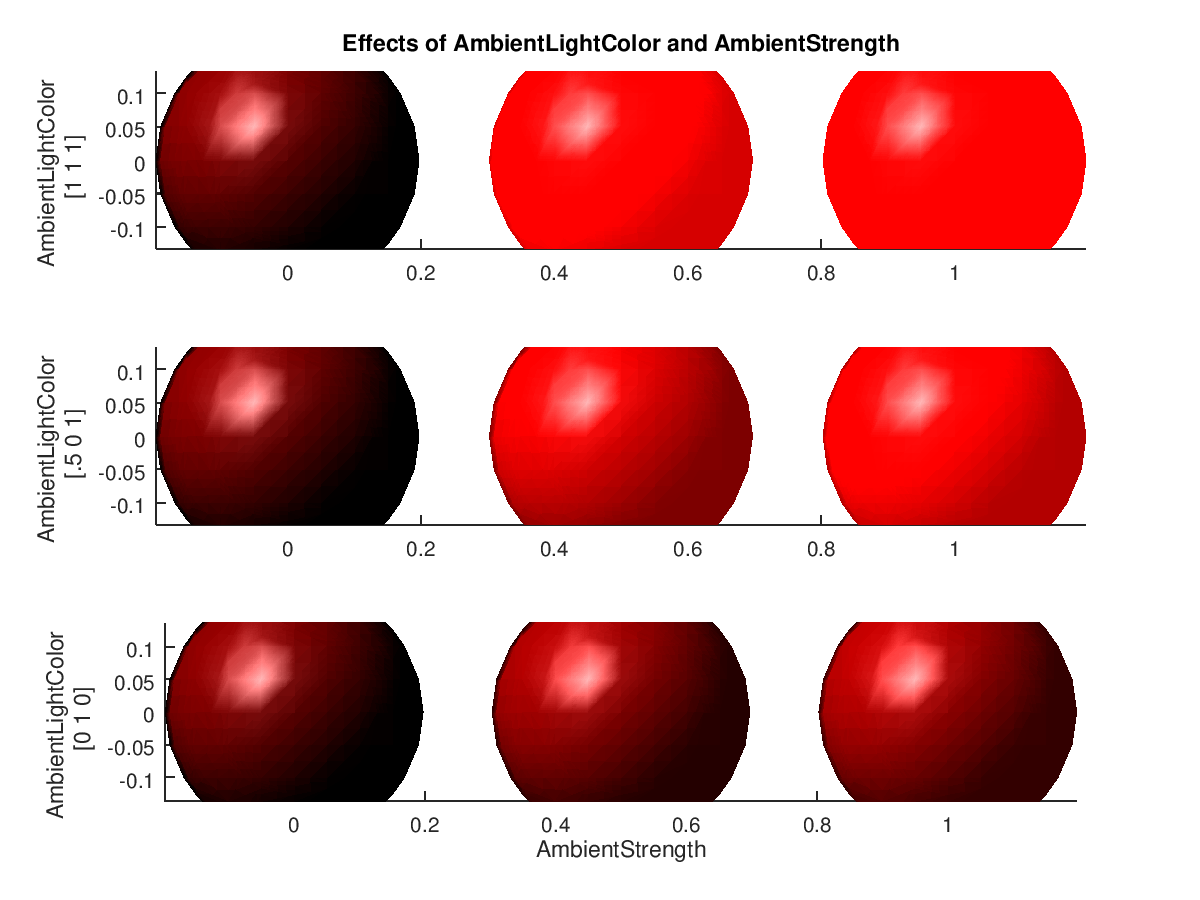
 ## Ambient Strength and Ambient Light Color
 clf;
 [x,y,z] = meshgrid (-.2:0.05:.2, -.2:0.05:.2, -.2:0.05:.2);
 val = (x.^2 + y.^2 + z.^2);

 h_axes1 = subplot (3,1,3);
 set (h_axes1, "AmbientLightColor", "g");
 fv = isosurface (x, y, z, val, .039);
 h_patch = patch (fv, "FaceColor", "r", "EdgeColor", "none", ...
                      "FaceLighting", "Gouraud");
 set (h_patch, "AmbientStrength", 0);
 isonormals (x, y, z, val, h_patch);
 fv = isosurface (x+.5, y, z, val, .039);
 h_patch = patch (fv, "FaceColor", "r", "EdgeColor", "none", ...
                      "FaceLighting", "Gouraud");
 set (h_patch, "AmbientStrength", .7);
 isonormals (x+.5, y, z, val, h_patch);
 fv = isosurface (x+1, y, z, val, .039);
 h_patch = patch (fv, "FaceColor", "r", "EdgeColor", "none", ...
                      "FaceLighting", "Gouraud");
 set (h_patch, "AmbientStrength", 1);
 isonormals (x+1, y, z, val, h_patch);
 h_light = light ("Position", [-1 1 1]);
 axis tight
 axis equal
 view (2);
 xlabel ("AmbientStrength");
 ylabel ({"AmbientLightColor", "[0 1 0]"});

 h_axes2 = subplot (3,1,2);
 set (h_axes2, "AmbientLightColor", [.5 0 1]);
 fv = isosurface (x, y, z, val, .039);
 h_patch = patch (fv, "FaceColor", "r", "EdgeColor", "none", ...
                      "FaceLighting", "Gouraud");
 set (h_patch, "AmbientStrength", 0);
 isonormals (x, y, z, val, h_patch);
 fv = isosurface (x+.5, y, z, val, .039);
 h_patch = patch (fv, "FaceColor", "r", "EdgeColor", "none", ...
                      "FaceLighting", "Gouraud");
 set (h_patch, "AmbientStrength", .7);
 isonormals (x+.5, y, z, val, h_patch);
 fv = isosurface (x+1, y, z, val, .039);
 h_patch = patch (fv, "FaceColor", "r", "EdgeColor", "none", ...
                      "FaceLighting", "Gouraud");
 set (h_patch, "AmbientStrength", 1);
 isonormals (x+1, y, z, val, h_patch);
 h_light = light ("Position", [-1 1 1]);
 axis tight
 axis equal
 view (2);
 ylabel ({"AmbientLightColor", "[.5 0 1]"});

 h_axes3 = subplot (3,1,1);
 set (h_axes3, "AmbientLightColor", "w");
 fv = isosurface (x, y, z, val, .039);
 h_patch = patch (fv, "FaceColor", "r", "EdgeColor", "none", ...
                      "FaceLighting", "Gouraud");
 set (h_patch, "AmbientStrength", 0);
 isonormals (x, y, z, val, h_patch);
 fv = isosurface (x+.5, y, z, val, .039);
 h_patch = patch (fv, "FaceColor", "r", "EdgeColor", "none", ...
                      "FaceLighting", "Gouraud");
 set (h_patch, "AmbientStrength", .7);
 isonormals (x+.5, y, z, val, h_patch);
 fv = isosurface (x+1, y, z, val, .039);
 h_patch = patch (fv, "FaceColor", "r", "EdgeColor", "none", ...
                      "FaceLighting", "Gouraud");
 set (h_patch, "AmbientStrength", 1);
 isonormals (x+1, y, z, val, h_patch);
 h_light = light ("Position", [-1 1 1]);
 axis tight
 axis equal
 view (2);
 ylabel ({"AmbientLightColor", "[1 1 1]"});
 title ("Effects of AmbientLightColor and AmbientStrength");
Produces the following figure
| Figure 1 |
|---|
 |
The following code
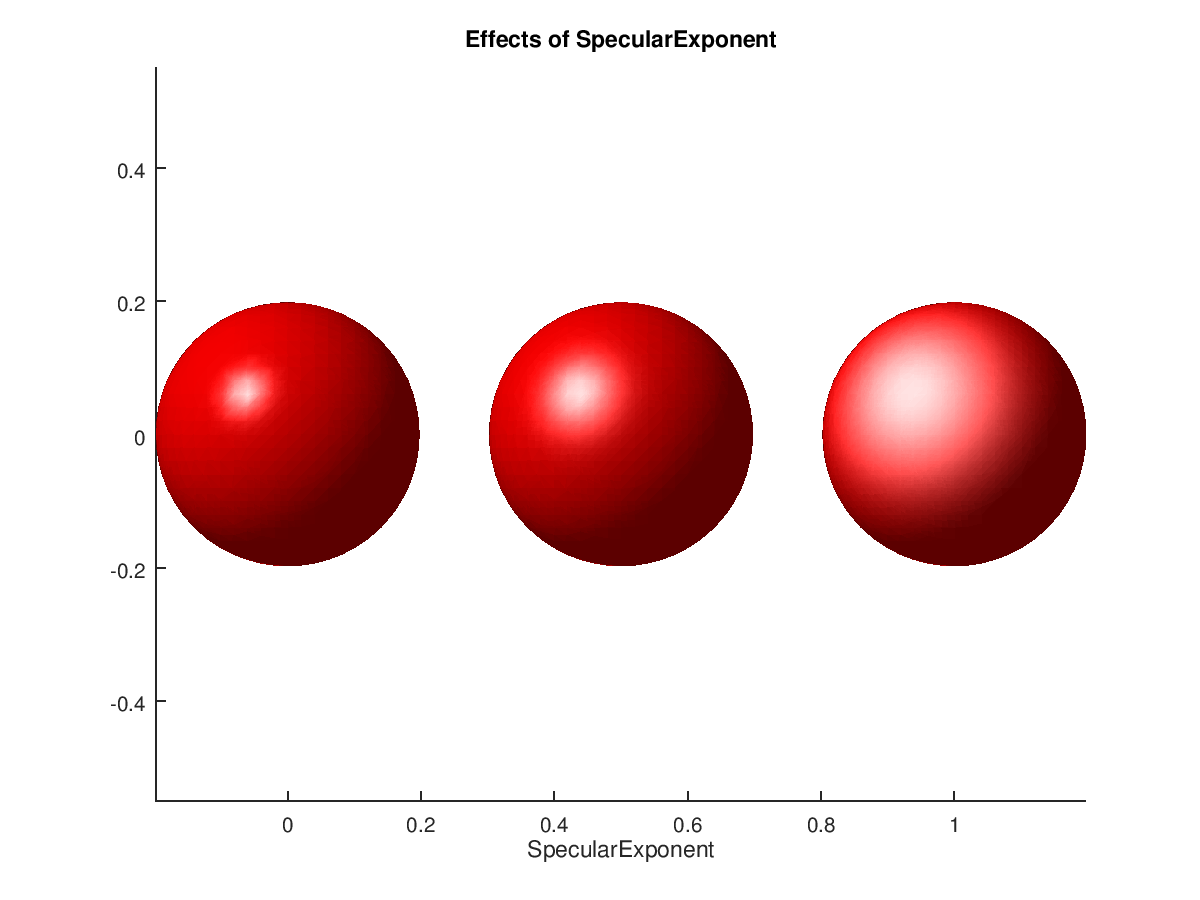
 ## Specular Exponent
 clf;
 [x,y,z] = meshgrid (-.2:0.02:.2, -.2:0.02:.2, -.2:0.02:.2);
 val = (x.^2 + y.^2 + z.^2);

 h_axes = axes ();
 fv = isosurface (x, y, z, val, .039);
 h_patch = patch (fv, "FaceColor", "r", "EdgeColor", "none", ...
                      "FaceLighting", "Gouraud");
 set (h_patch, "SpecularExponent", 15);
 isonormals (x, y, z, val, h_patch);
 fv = isosurface (x+.5, y, z, val, .039);
 h_patch = patch (fv, "FaceColor", "r", "EdgeColor", "none", ...
                      "FaceLighting", "Gouraud");
 set (h_patch, "SpecularExponent", 5);
 isonormals (x+.5, y, z, val, h_patch);
 fv = isosurface (x+1, y, z, val, .039);
 h_patch = patch (fv, "FaceColor", "r", "EdgeColor", "none", ...
                      "FaceLighting", "Gouraud");
 set (h_patch, "SpecularExponent", 1);
 isonormals (x+1, y, z, val, h_patch);
 h_light = light ("Position", [-1 1 1]);
 axis tight
 axis equal
 view (2);
 xlabel ("SpecularExponent");
 title ("Effects of SpecularExponent");
Produces the following figure
| Figure 1 |
|---|
 |
The following code
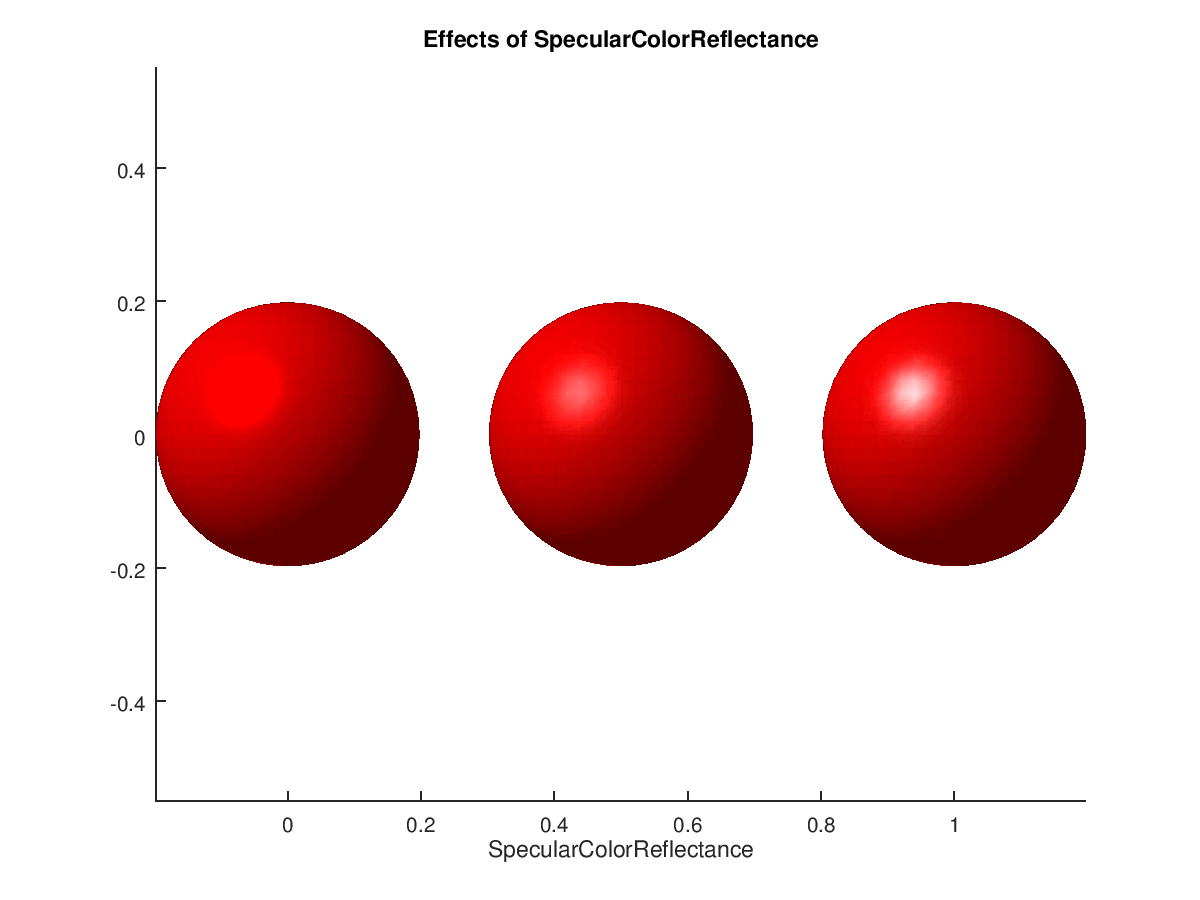
 ## SpecularColorReflectance
 clf;
 [x,y,z] = meshgrid (-.2:0.02:.2, -.2:0.02:.2, -.2:0.02:.2);
 val = (x.^2 + y.^2 + z.^2);

 h_axes = axes ();
 fv = isosurface (x, y, z, val, .039);
 h_patch = patch (fv, "FaceColor", "r", "EdgeColor", "none", ...
                      "FaceLighting", "Gouraud");
 set (h_patch, "SpecularColorReflectance", 0);
 isonormals (x, y, z, val, h_patch);
 fv = isosurface (x+.5, y, z, val, .039);
 h_patch = patch (fv, "FaceColor", "r", "EdgeColor", "none", ...
                      "FaceLighting", "Gouraud");
 set (h_patch, "SpecularColorReflectance", 0.5);
 isonormals (x+.5, y, z, val, h_patch);
 fv = isosurface (x+1, y, z, val, .039);
 h_patch = patch (fv, "FaceColor", "r", "EdgeColor", "none", ...
                      "FaceLighting", "Gouraud");
 set (h_patch, "SpecularColorReflectance", 1);
 isonormals (x+1, y, z, val, h_patch);
 h_light = light ("Position", [-1 1 1]);
 axis tight
 axis equal
 view (2);
 xlabel ("SpecularColorReflectance");
 title ("Effects of SpecularColorReflectance");
Produces the following figure
| Figure 1 |
|---|
 |
The following code
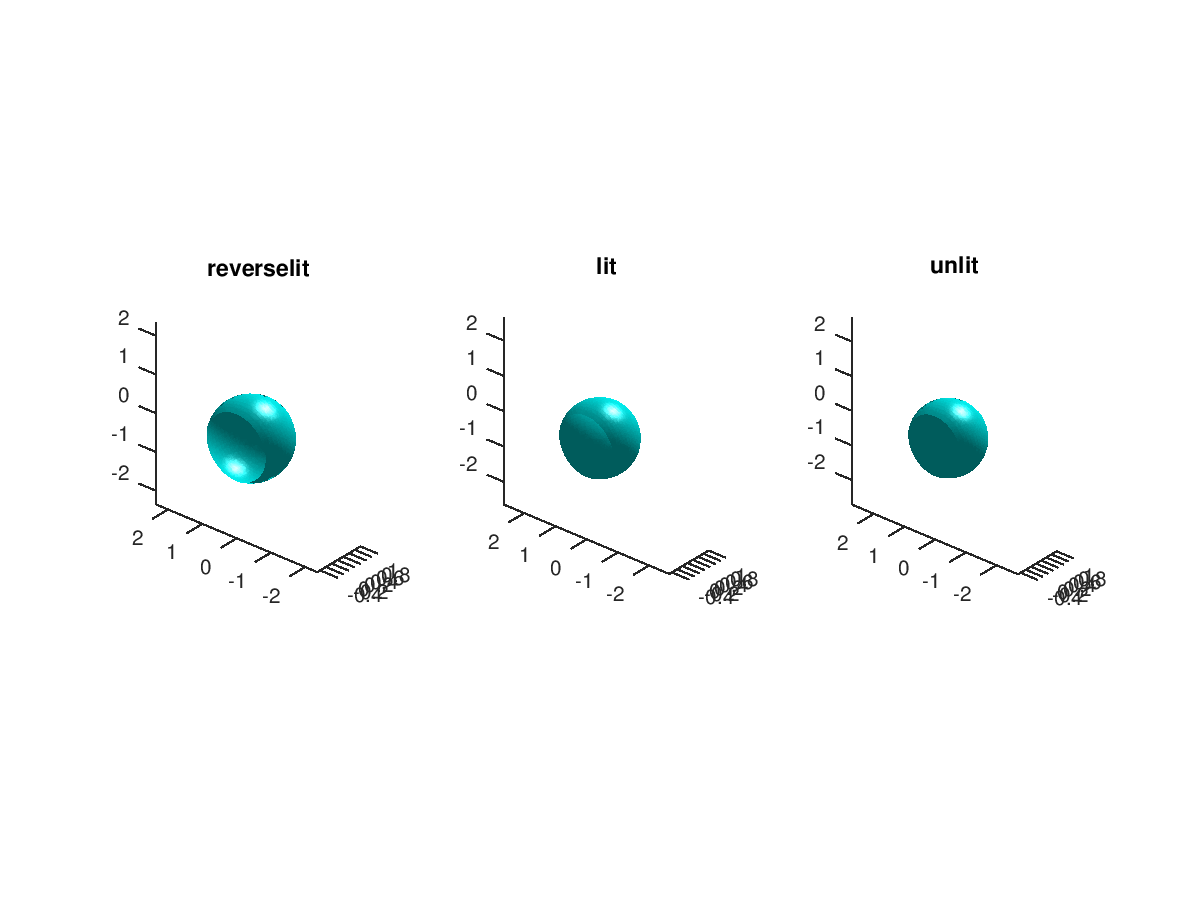
 ## BackFaceLighting
 [x,y,z] = meshgrid (-.5:0.1:2, -2:0.1:2, -2:0.1:2);
 val = x.^2 + y.^2 + z.^2;
 fv = isosurface (x, y, z, val, 1);
 vn = isonormals (x, y, z, val, fv.vertices);
 h_axes1 = subplot (1, 3, 1);
 h_patch = patch (fv, "FaceColor", "c", "EdgeColor", "none", ...
                      "FaceLighting", "Gouraud", "VertexNormals", vn);
 set (h_patch, "BackFaceLighting", "reverselit");
 h_light = light ();
 view (h_axes1, [-50 30]);
 title ("reverselit");
 axis equal

 h_axes2 = subplot (1, 3, 2);
 h_patch = patch (fv, "FaceColor", "c", "EdgeColor", "none", ...
                      "FaceLighting", "Gouraud", "VertexNormals", -vn);
 set (h_patch, "BackFaceLighting", "lit");
 h_light = light ();
 view (h_axes2, [-50 30]);
 title ("lit");
 axis equal

 h_axes3 = subplot (1, 3, 3);
 h_patch = patch (fv, "FaceColor", "c", "EdgeColor", "none", ...
                      "FaceLighting", "Gouraud", "VertexNormals", -vn);
 set (h_patch, "BackFaceLighting", "unlit");
 h_light = light ();
 view (h_axes3, [-50 30]);
 title ("unlit");
 axis equal
Produces the following figure
| Figure 1 |
|---|
 |
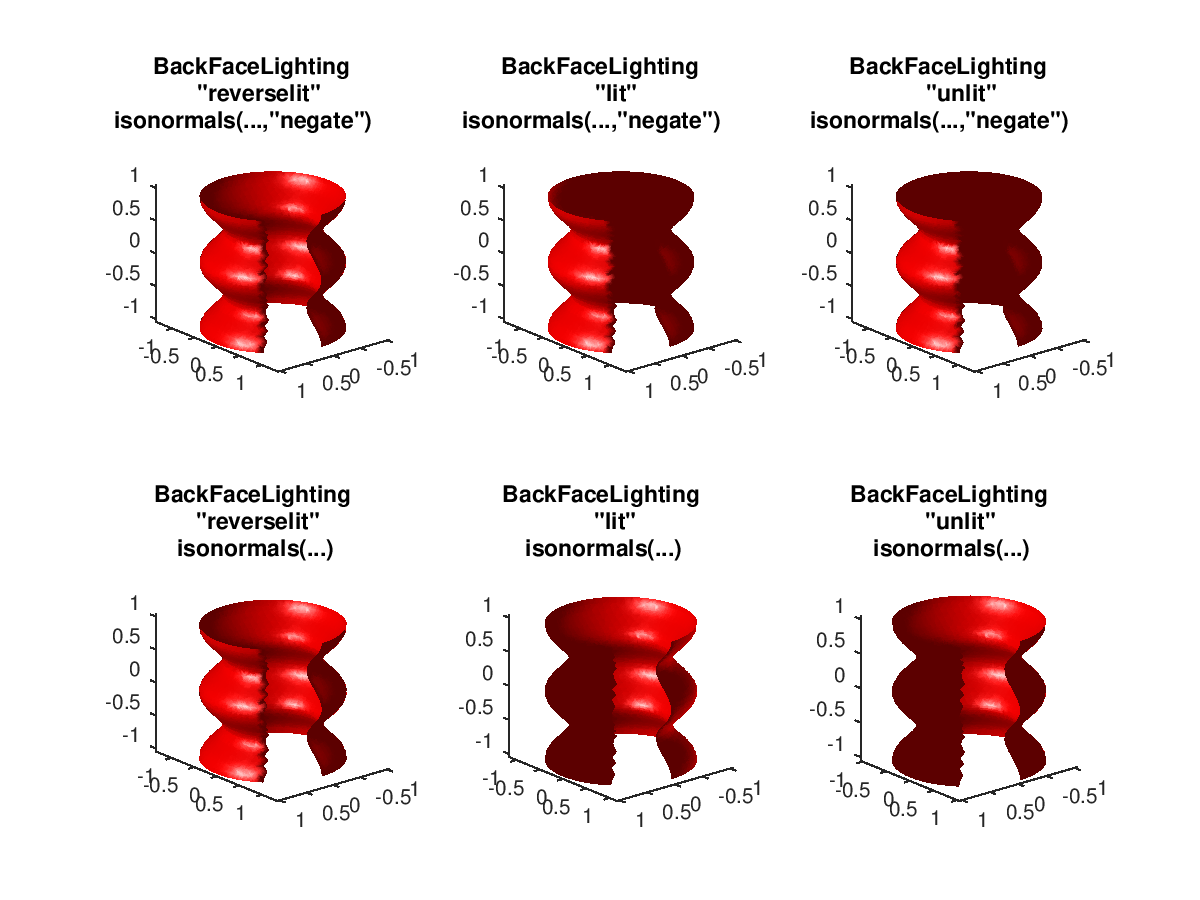
The following code
 ## BackFaceLighting 2
 ## Matlab fails for "reverselit" with negated isonormals and for "unlit"
 N = 30; iso = .8;
 lin = linspace (-1, 1, N);
 [x, y, z] = meshgrid (1.2*lin, 1.2*lin, lin);
 val = (x).^2 + (y).^2 - iso/2.7*cos (2*pi*z);
 val(x>0 & (y-x)>0) = NaN;
 fv = isosurface (x, y, z, val, iso);
 vn = isonormals (x, y, z, val, fv.vertices);

 clf;
 subplot (2, 3, 1);
 view (140, 20);
 axis equal
 hp = patch (fv, "FaceColor", "r", "EdgeColor", "none", ...
             "BackFaceLighting", "reverselit", "VertexNormals", -vn);
 hl = light ("Position", [1 0 .5]);
 lighting gouraud
 title ({"BackFaceLighting", '"reverselit"', 'isonormals(...,"negate")'});

 subplot (2, 3, 2);
 view (140, 20);
 axis equal
 hp = patch (fv, "FaceColor", "r", "EdgeColor", "none", ...
             "BackFaceLighting", "lit", "VertexNormals", -vn);
 hl = light ("Position", [1 0 .5]);
 lighting gouraud
 title ({"BackFaceLighting", '"lit"', 'isonormals(...,"negate")'});

 subplot (2, 3, 3);
 view (140, 20);
 axis equal
 hp = patch (fv, "FaceColor", "r", "EdgeColor", "none", ...
             "BackFaceLighting", "unlit", "VertexNormals", -vn);
 hl = light ("Position", [1 0 .5]);
 lighting gouraud
 title ({"BackFaceLighting", '"unlit"', 'isonormals(...,"negate")'});

 subplot (2, 3, 4);
 view (140, 20);
 axis equal
 hp = patch (fv, "FaceColor", "r", "EdgeColor", "none", ...
             "BackFaceLighting", "reverselit", "VertexNormals", vn);
 hl = light ("Position", [1 0 .5]);
 lighting gouraud
 title ({"BackFaceLighting", '"reverselit"', "isonormals(...)"});

 subplot (2, 3, 5);
 view (140, 20);
 axis equal
 hp = patch (fv, "FaceColor", "r", "EdgeColor", "none", ...
             "BackFaceLighting", "lit", "VertexNormals", vn);
 hl = light ("Position", [1 0 .5]);
 lighting gouraud
 title ({"BackFaceLighting", '"lit"', "isonormals(...)"});

 subplot (2, 3, 6);
 view (140, 20);
 axis equal
 hp = patch (fv, "FaceColor", "r", "EdgeColor", "none", ...
             "BackFaceLighting", "unlit", "VertexNormals", vn);
 hl = light ("Position", [1 0 .5]);
 lighting gouraud
 title ({"BackFaceLighting", '"unlit"', "isonormals(...)"});
Produces the following figure
| Figure 1 |
|---|
 |
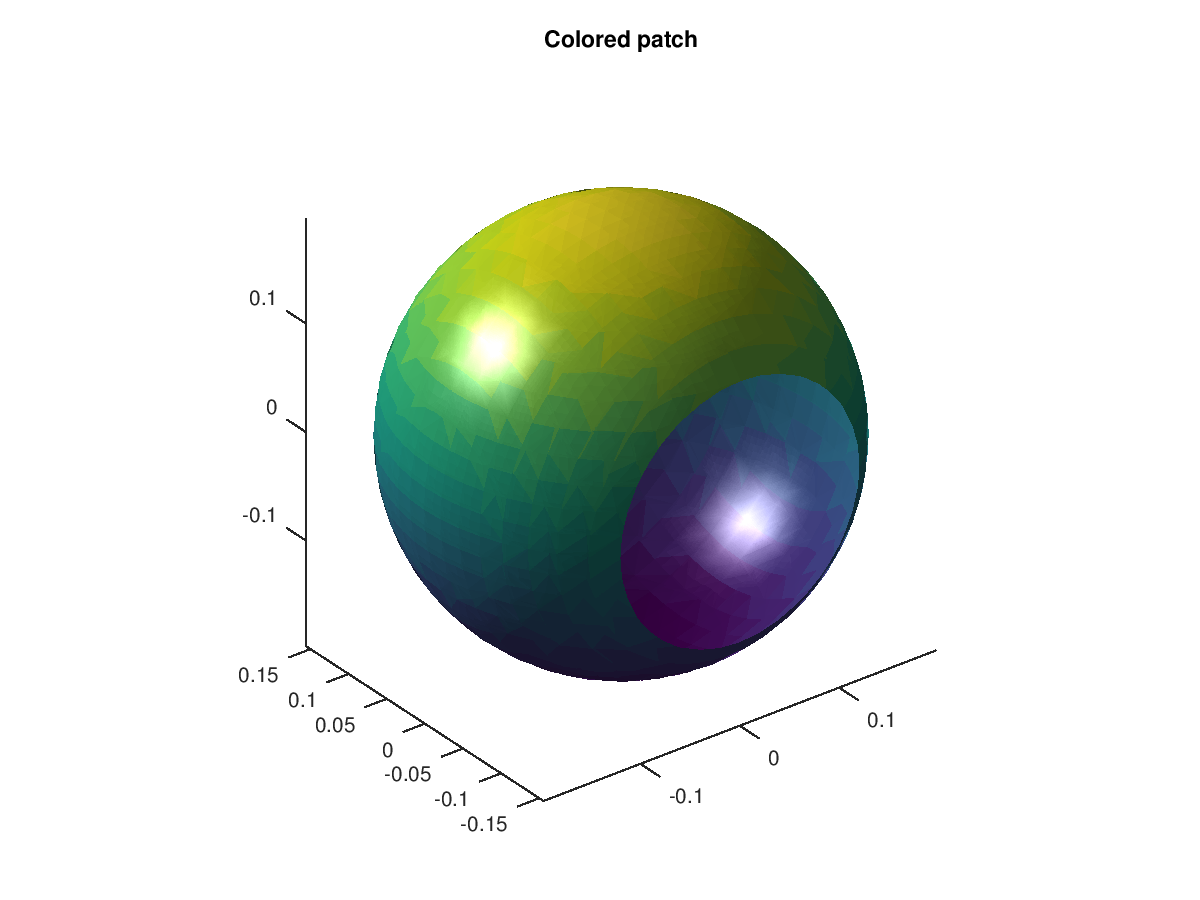
The following code
 ## Colored patch
 clf;
 [x,y,z] = meshgrid (-.2:0.02:.2, -.2:0.02:.2, -.2:0.02:.2);
 val = (x.^2 + y.^2 + z.^2);

 h_axes = axes ();
 fv = isosurface (x, y, z, val, .039, z);
 h_patch = patch (fv, "FaceColor", "flat", "EdgeColor", "none", ...
                      "FaceLighting", "Gouraud");
 set (h_patch, "SpecularExponent", 15);
 isonormals (x, y, z, val, h_patch);
 title ("Colored patch");
 h_light = light ("Position", [-1 1 1]);
 axis tight
 axis equal
 view (3);
Produces the following figure
| Figure 1 |
|---|
 |
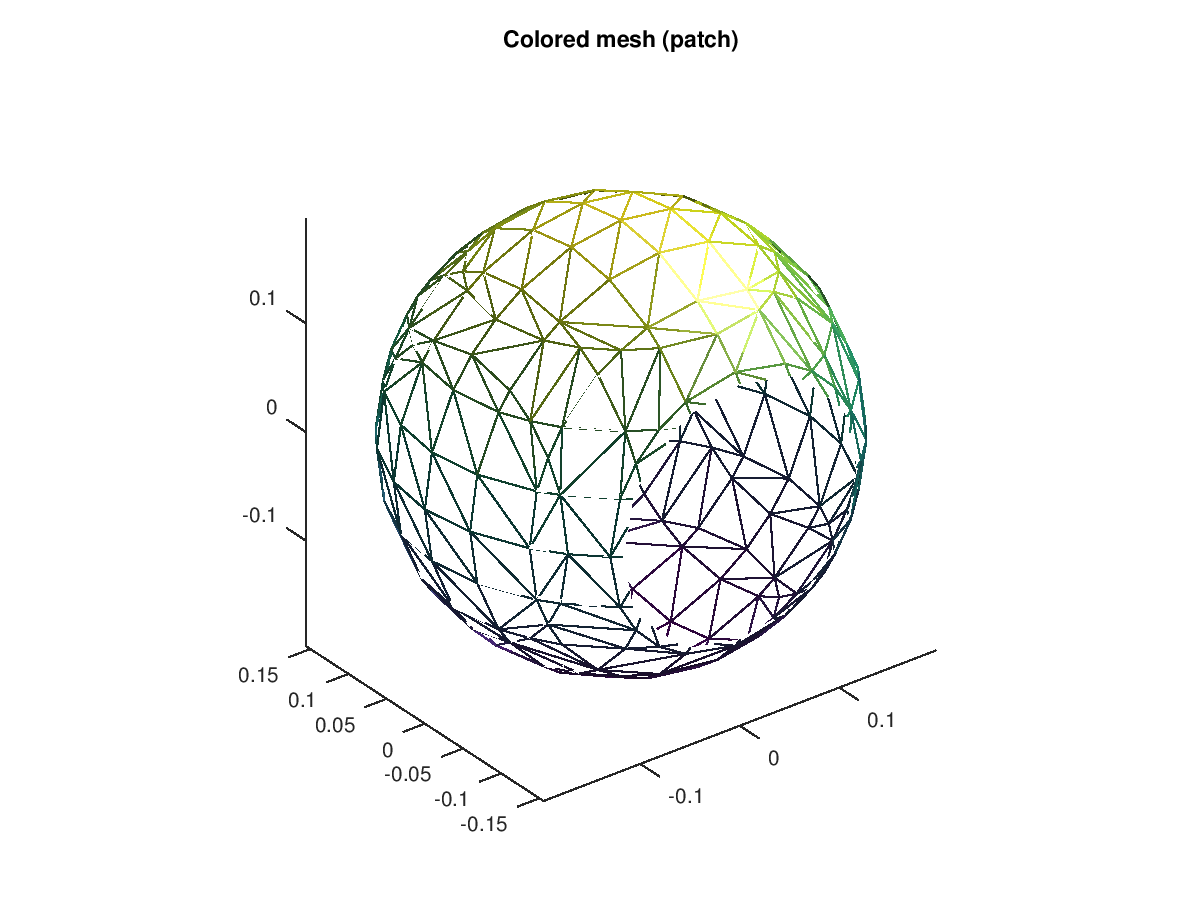
The following code
 ## Colored mesh (patch)
 clf;
 [x,y,z] = meshgrid (-.2:0.05:.2, -.2:0.05:.2, -.2:0.05:.2);
 val = (x.^2 + y.^2 + z.^2);

 h_axes = axes ();
 fv = isosurface (x, y, z, val, .039, z);
 h_patch = patch (fv, "FaceColor", "w", "EdgeColor", "interp");
 isonormals (x, y, z, val, h_patch);
 title ("Colored mesh (patch)");
 h_light = light;
 lighting gouraud
 axis tight;
 axis equal;
 box off;
 view (3);
Produces the following figure
| Figure 1 |
|---|
 |
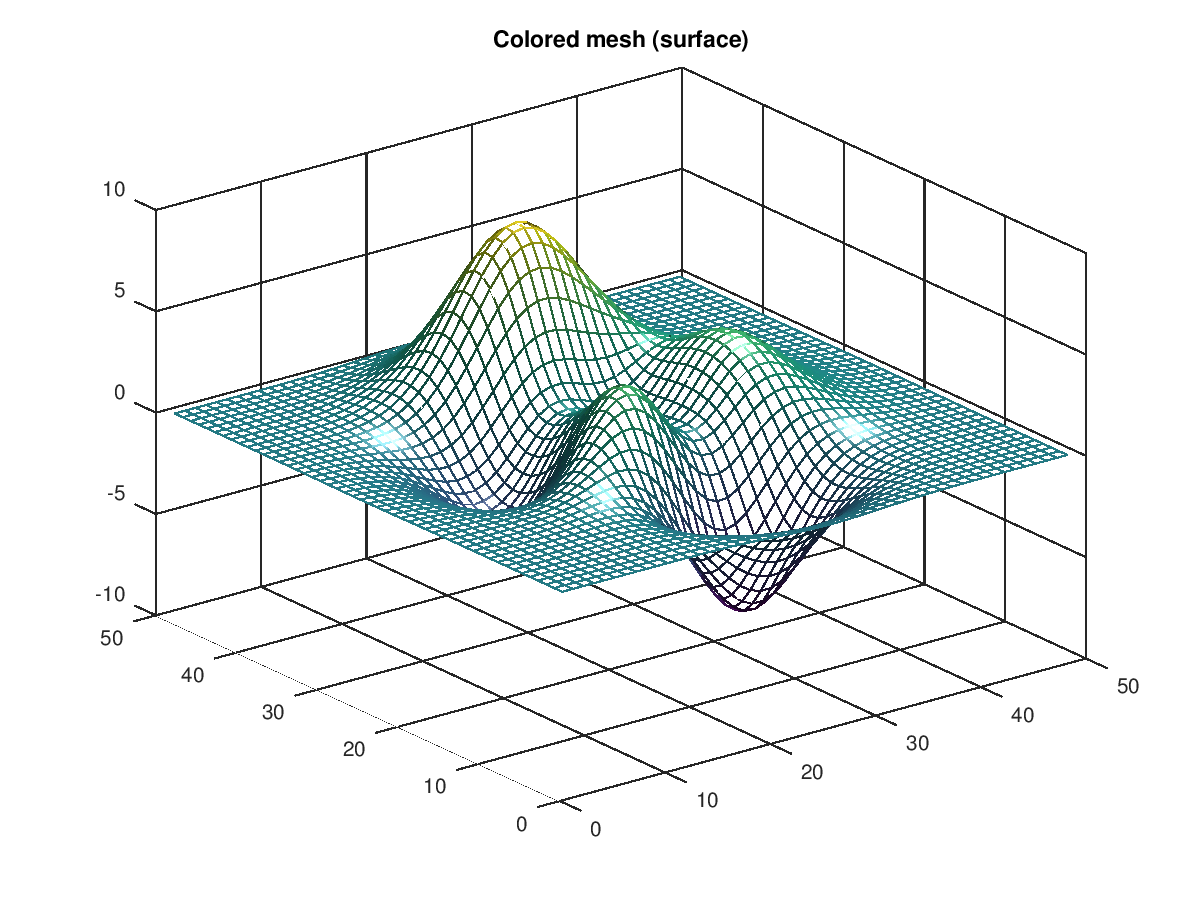
The following code
 ## Colored mesh (surface)
 clf;
 h_mesh = mesh (peaks);
 title ("Colored mesh (surface)");
 h_light = light;
 lighting gouraud
Produces the following figure
| Figure 1 |
|---|
 |
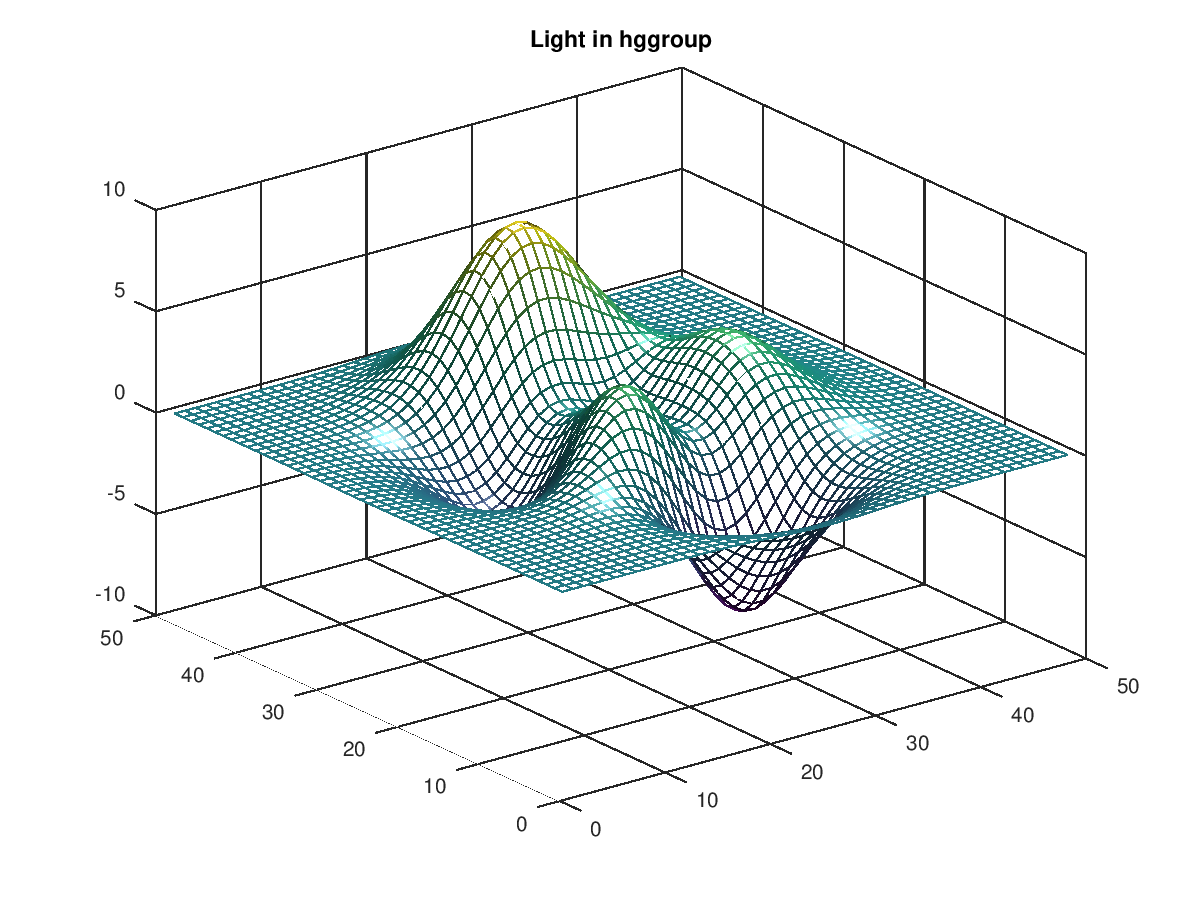
The following code
 ## Light in hggroup
 clf;
 h_mesh = mesh (peaks);
 h_hg = hggroup ();
 title ("Light in hggroup");
 h_light = light ("Parent", h_hg);
 lighting gouraud
Produces the following figure
| Figure 1 |
|---|
 |
The following code
 ## Style local/infinite
 clf;
 [x,y,z] = meshgrid (-.2:0.02:.2, -.2:0.02:.2, -.2:0.02:.2);
 val = (x.^2 + y.^2 + z.^2);

 h_axes1 = subplot (1,2,1);
 fv = isosurface (x, y, z, val, .039);
 h_patch = patch (fv, "FaceColor", "r", "EdgeColor", "none");
 isonormals (x, y, z, val, h_patch);
 title ('"Style" = "infinite" (default)');
 h_light = light ("Position", [.3 0 .3]);
 lighting gouraud
 axis equal
 view (3);

 h_axes2 = subplot (1,2,2);
 fv = isosurface (x, y, z, val, .039);
 h_patch = patch (fv, "FaceColor", "r", "EdgeColor", "none");
 isonormals (x, y, z, val, h_patch);
 title ('"Style" = "local"');
 h_light = light ("Style", "local", "Position", [.3 0 .3]);
 lighting gouraud
 axis equal
 view (3);
Produces the following figure
| Figure 1 |
|---|
 |
Package: octave