
|
Octave-Forge - Extra packages for GNU Octave |
| Home · Packages · Developers · Documentation · FAQ · Bugs · Mailing Lists · Links · Code |
|
|
Octave-Forge - Extra packages for GNU Octave |
| Home · Packages · Developers · Documentation · FAQ · Bugs · Mailing Lists · Links · Code |
Plot a 3-D waterfall plot.
A waterfall plot is similar to a meshz plot except only
mesh lines for the rows of z (x-values) are shown.
The wireframe mesh is plotted using rectangles. The vertices of the
rectangles [x, y] are typically the output of meshgrid.
over a 2-D rectangular region in the x-y plane. z determines the
height above the plane of each vertex. If only a single z matrix is
given, then it is plotted over the meshgrid
x = 1:columns (z), y = 1:rows (z).
Thus, columns of z correspond to different x values and rows
of z correspond to different y values.
The color of the mesh is computed by linearly scaling the z values
to fit the range of the current colormap. Use caxis and/or
change the colormap to control the appearance.
Optionally the color of the mesh can be specified independently of z by supplying a color matrix, c.
Any property/value pairs are passed directly to the underlying surface object.
If the first argument hax is an axes handle, then plot into this axis,
rather than the current axes returned by gca.
The optional return value h is a graphics handle to the created surface object.
See also: meshz, mesh, meshc, contour, surf, surface, ribbon, meshgrid, hidden, shading, colormap, caxis.
The following code
 clf;
 colormap ("default");
 Z = peaks ();
 waterfall (Z);
 title ("waterfall() plot of peaks() function");
Produces the following figure
| Figure 1 |
|---|
 |
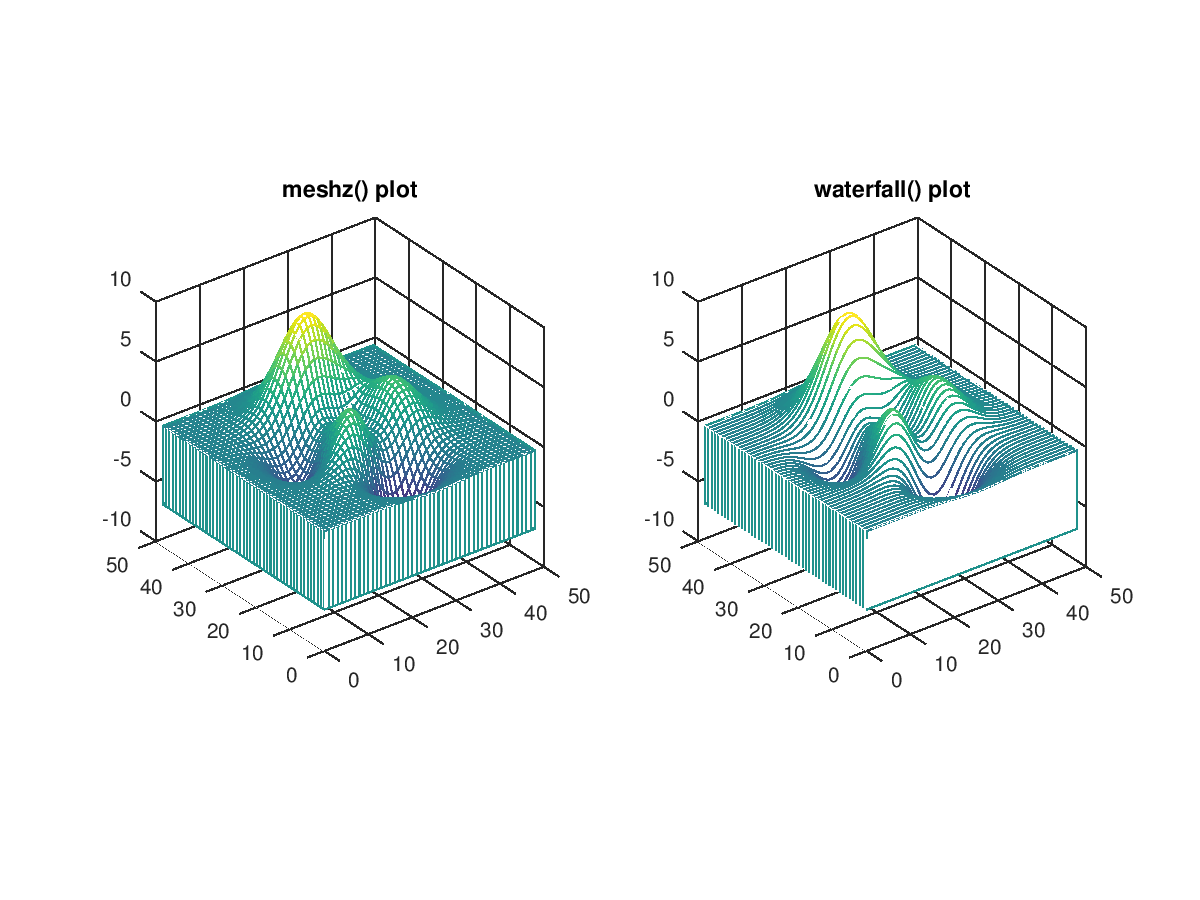
The following code
 clf;
 colormap ("default");
 Z = peaks ();
 subplot (1,2,1)
  meshz (Z);
  daspect ([2.5, 2.5, 1]);
  title ("meshz() plot");
 subplot (1,2,2)
  waterfall (Z);
  daspect ([2.5, 2.5, 1]);
  title ("waterfall() plot");
Produces the following figure
| Figure 1 |
|---|
 |
Package: octave